

Chart of total period Ruhstorf / Rott
Discharge from 01.11.1964 to 27.04.2024
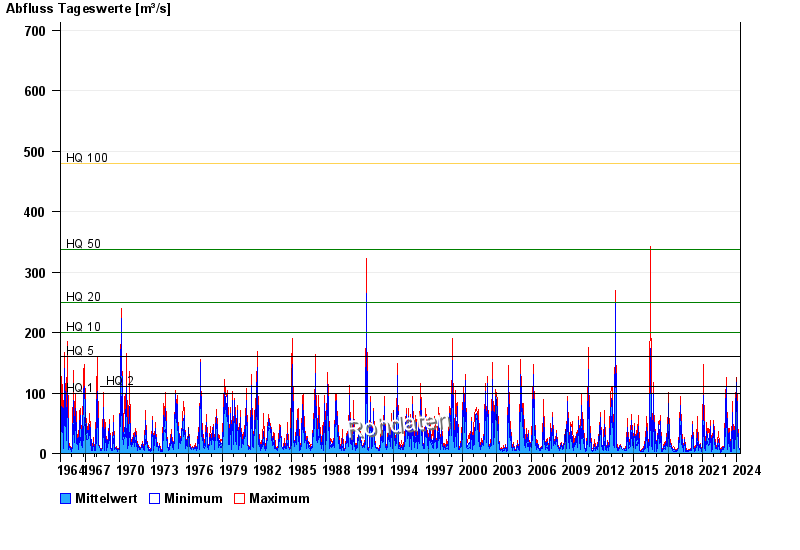
- HQ1 100 m³/s
- HQ2 110 m³/s
- HQ5 160 m³/s
- HQ10 200 m³/s
- HQ20 250 m³/s
- HQ50 337 m³/s
- HQ100 480 m³/s
| Date | Mean value [m³/s] | Maximum [m³/s] | Minimum [m³/s] |
|---|---|---|---|
| 27.04.2024 | 6.45 | 7.53 | 6.23 |
| 26.04.2024 | 6.51 | 7.79 | 5.74 |
| 25.04.2024 | 7.35 | 8.06 | 6.48 |
| 24.04.2024 | 6.91 | 7.53 | 6.23 |
| 23.04.2024 | 8.63 | 9.73 | 7.53 |
| 22.04.2024 | 6.92 | 7.79 | 6.23 |
| 21.04.2024 | 7.14 | 7.53 | 6.74 |
© Bayerisches Landesamt für Umwelt 2024