
- Start >
- Rivers >
- Discharge >
- Bayern >
- Rottersdorf >
- Chart of year

Chart of year Rottersdorf / Vils
Discharge from 01.01.2022 to 31.12.2022
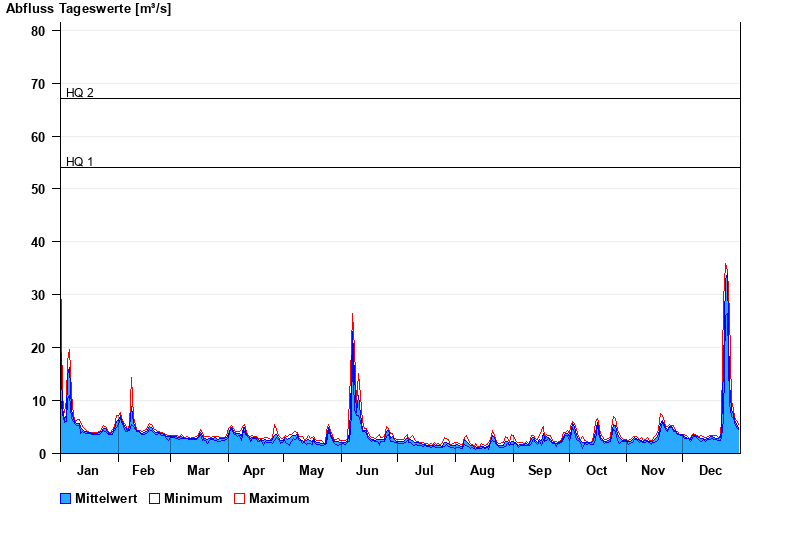
- HQ1 54 m³/s
- HQ2 67 m³/s
- HQ5 85 m³/s
- HQ10 98 m³/s
- HQ20 110 m³/s
| Date | Mean value [m³/s] | Maximum [m³/s] | Minimum [m³/s] |
|---|---|---|---|
| 31.12.2022 | 5.34 | 6.01 | 5.04 |
| 30.12.2022 | 6.07 | 6.85 | 5.51 |
| 29.12.2022 | 6.94 | 7.46 | 6.28 |
| 28.12.2022 | 8.05 | 9.13 | 7.46 |
| 27.12.2022 | 9.13 | 11 | 7.79 |
| 26.12.2022 | 14.4 | 27.9 | 10.2 |
| 25.12.2022 | 35.4 | 35.9 | 28.5 |
© Bayerisches Landesamt für Umwelt 2024