
- Start >
- Rivers >
- Discharge >
- Bayern >
- Rottersdorf >
- Chart of year

Chart of year Rottersdorf / Vils
Discharge from 01.01.2023 to 31.12.2023
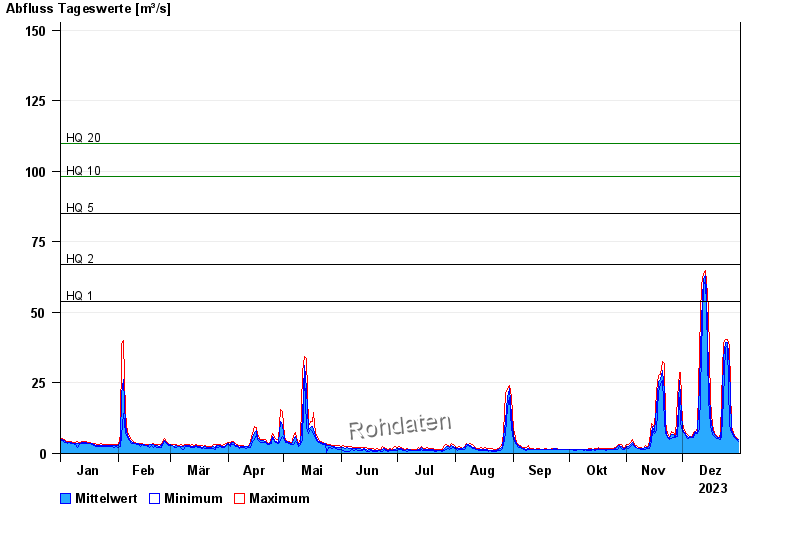
- HQ1 54 m³/s
- HQ2 67 m³/s
- HQ5 85 m³/s
- HQ10 98 m³/s
- HQ20 110 m³/s
| Date | Mean value [m³/s] | Maximum [m³/s] | Minimum [m³/s] |
|---|---|---|---|
| 31.12.2023 | 4.81 | 5.06 | 4.4 |
| 30.12.2023 | 5.38 | 5.81 | 5.06 |
| 29.12.2023 | 5.87 | 6.35 | 5.55 |
| 28.12.2023 | 6.76 | 7.55 | 6.07 |
| 27.12.2023 | 8.23 | 9.61 | 7.55 |
| 26.12.2023 | 30.8 | 38.3 | 9.97 |
| 25.12.2023 | 39.5 | 40.3 | 38.3 |
© Bayerisches Landesamt für Umwelt 2024