
- Start >
- Rivers >
- Discharge >
- Bayern >
- Rothaurach >
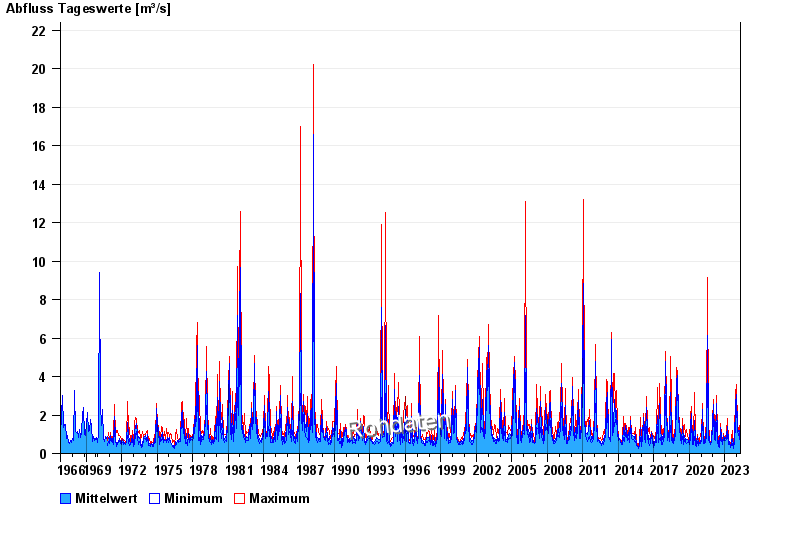
- Chart of total period

Chart of total period Rothaurach / Aurach
Discharge from 01.11.1966 to 29.04.2024
| Date | Mean value [m³/s] | Maximum [m³/s] | Minimum [m³/s] |
|---|---|---|---|
| 29.04.2024 | 0.424 | 0.424 | 0.424 |
| 28.04.2024 | 0.426 | 0.449 | 0.424 |
| 27.04.2024 | 0.452 | 0.475 | 0.449 |
| 26.04.2024 | 0.475 | 0.475 | 0.475 |
| 25.04.2024 | 0.475 | 0.475 | 0.475 |
| 24.04.2024 | 0.486 | 0.53 | 0.475 |
| 23.04.2024 | 0.544 | 0.589 | 0.53 |
© Bayerisches Landesamt für Umwelt 2024