
- Start >
- Rivers >
- Discharge >
- Bayern >
- Roth Kläranlage >
- Chart of total period

Chart of total period Roth Kläranlage / Rednitz
Discharge from 01.11.1966 to 03.05.2024
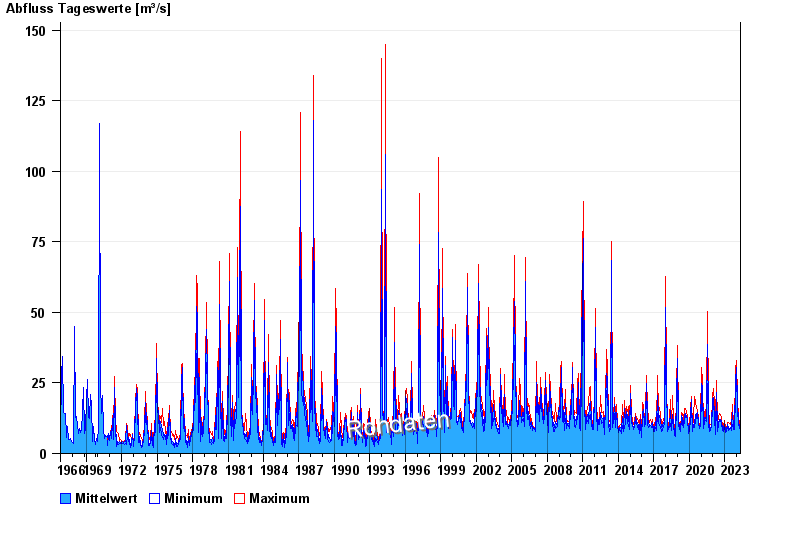
| Date | Mean value [m³/s] | Maximum [m³/s] | Minimum [m³/s] |
|---|---|---|---|
| 03.05.2024 | 8.25 | 8.42 | 8.12 |
| 02.05.2024 | 8.36 | 8.42 | 8.24 |
| 01.05.2024 | 7.38 | 8.42 | 5.78 |
| 30.04.2024 | 6.56 | 6.69 | 6.38 |
| 29.04.2024 | 5.4 | 6.69 | 4.08 |
| 28.04.2024 | 4.35 | 4.63 | 4.21 |
| 27.04.2024 | 4.58 | 4.77 | 4.35 |
© Bayerisches Landesamt für Umwelt 2024