

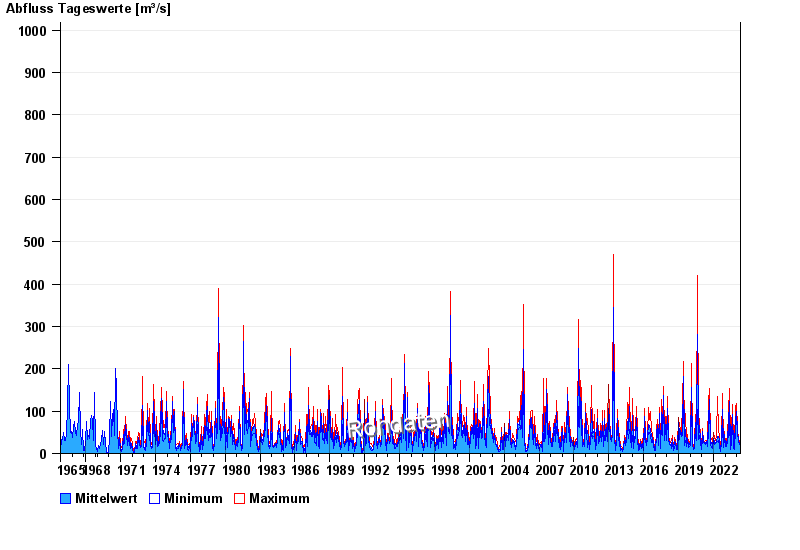
Chart of total period Rosenheim / Mangfall
Discharge from 01.11.1965 to 29.04.2024
 Für diesen Pegel sind keine Jährlichkeiten hinterlegt.
| Date | Mean value [m³/s] | Maximum [m³/s] | Minimum [m³/s] |
|---|---|---|---|
| 29.04.2024 | 24.1 | 25.3 | 22.5 |
| 28.04.2024 | 21.6 | 25.3 | 19.2 |
| 27.04.2024 | 17.3 | 19.2 | 16 |
| 26.04.2024 | 17.4 | 18.6 | 16.7 |
| 25.04.2024 | 19.6 | 22.5 | 17.3 |
| 24.04.2024 | 20.1 | 22.5 | 18.6 |
| 23.04.2024 | 20 | 21.8 | 18.6 |
© Bayerisches Landesamt für Umwelt 2024