
- Start >
- Rivers >
- Discharge >
- Bayern >
- Römershofen >
- Chart of total period

Chart of total period Römershofen / Nassach
Discharge from 01.11.1979 to 08.05.2024
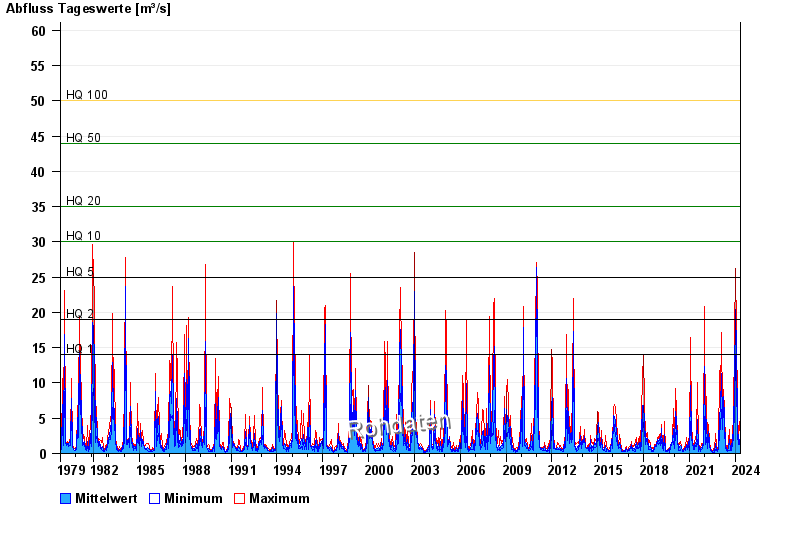
- HQ1 14 m³/s
- HQ2 19 m³/s
- HQ5 25 m³/s
- HQ10 30 m³/s
- HQ20 35 m³/s
- HQ50 44 m³/s
- HQ100 50 m³/s
| Date | Mean value [m³/s] | Maximum [m³/s] | Minimum [m³/s] |
|---|---|---|---|
| 08.05.2024 | 0.692 | 0.747 | 0.659 |
| 07.05.2024 | 0.801 | 0.848 | 0.747 |
| 06.05.2024 | 0.754 | 0.848 | 0.703 |
| 05.05.2024 | 0.83 | 1.01 | 0.615 |
| 04.05.2024 | 0.723 | 0.848 | 0.615 |
| 03.05.2024 | 1.3 | 1.64 | 0.848 |
| 02.05.2024 | 0.659 | 1.52 | 0.571 |
© Bayerisches Landesamt für Umwelt 2024