

Chart of year Rieblich / Rodach
Discharge from 20.04.2024 to 19.04.2025
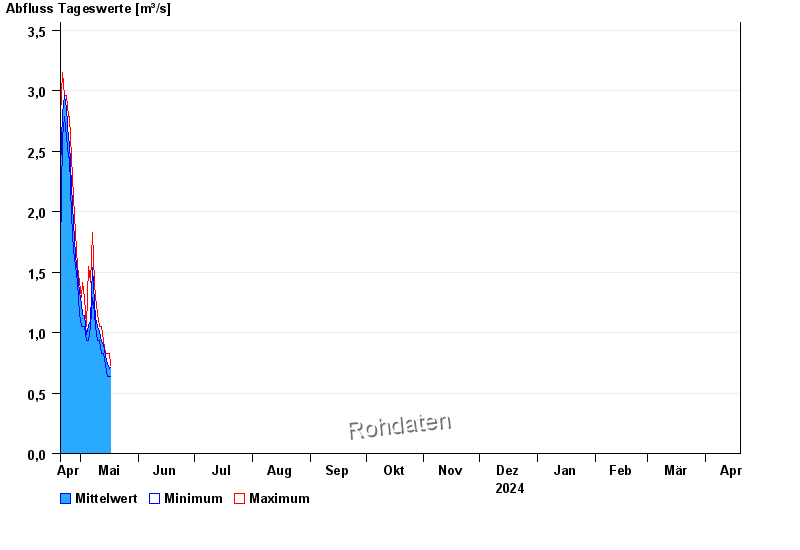
| Date | Mean value [m³/s] | Maximum [m³/s] | Minimum [m³/s] |
|---|---|---|---|
| 01.06.2024 | 1.75 | 2.12 | 1.41 |
| 31.05.2024 | 1.53 | 1.83 | 1.41 |
| 30.05.2024 | 1.8 | 2.12 | 1.41 |
| 29.05.2024 | 1.61 | 1.68 | 1.41 |
| 28.05.2024 | 1.89 | 2.12 | 1.68 |
| 27.05.2024 | 2.12 | 2.61 | 1.97 |
| 26.05.2024 | 2.46 | 2.61 | 2.12 |
© Bayerisches Landesamt für Umwelt 2024