
- Start >
- Rivers >
- Discharge >
- Bayern >
- Reichenbach >
- Chart of year

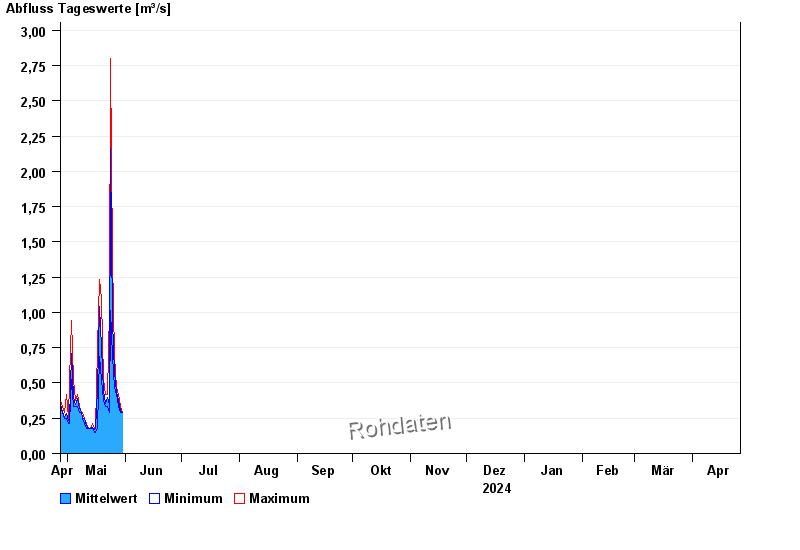
Chart of year Reichenbach / Wörnitz
Discharge from 27.04.2024 to 26.04.2025
| Date | Mean value [m³/s] | Maximum [m³/s] | Minimum [m³/s] |
|---|---|---|---|
| 10.06.2024 | 0.498 | 0.576 | 0.421 |
| 09.06.2024 | 0.625 | 0.688 | 0.576 |
| 08.06.2024 | 0.747 | 0.813 | 0.688 |
| 07.06.2024 | 0.882 | 0.945 | 0.813 |
| 06.06.2024 | 1.04 | 1.16 | 0.945 |
| 05.06.2024 | 1.27 | 1.46 | 1.16 |
| 04.06.2024 | 2.17 | 4.1 | 1.46 |
© Bayerisches Landesamt für Umwelt 2024