

Chart of year Puppling / Isar
Discharge from 03.06.2023 to 02.06.2024
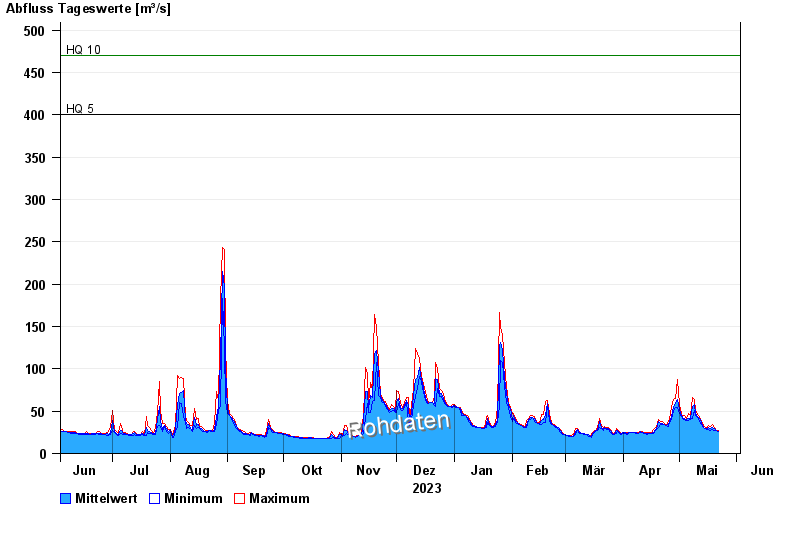
- HQ5 400 m³/s
- HQ10 470 m³/s
- HQ20 540 m³/s
- HQ100 690 m³/s
| Date | Mean value [m³/s] | Maximum [m³/s] | Minimum [m³/s] |
|---|---|---|---|
| 03.05.2024 | 43.5 | 43.8 | 42.9 |
| 02.05.2024 | 45.4 | 47.7 | 43.8 |
| 01.05.2024 | 51.4 | 57.8 | 47.7 |
| 30.04.2024 | 63.3 | 87.1 | 54.8 |
| 29.04.2024 | 59.1 | 64.9 | 53.8 |
| 28.04.2024 | 55.2 | 63.9 | 50.7 |
| 27.04.2024 | 43.4 | 53.8 | 40.1 |
© Bayerisches Landesamt für Umwelt 2024