

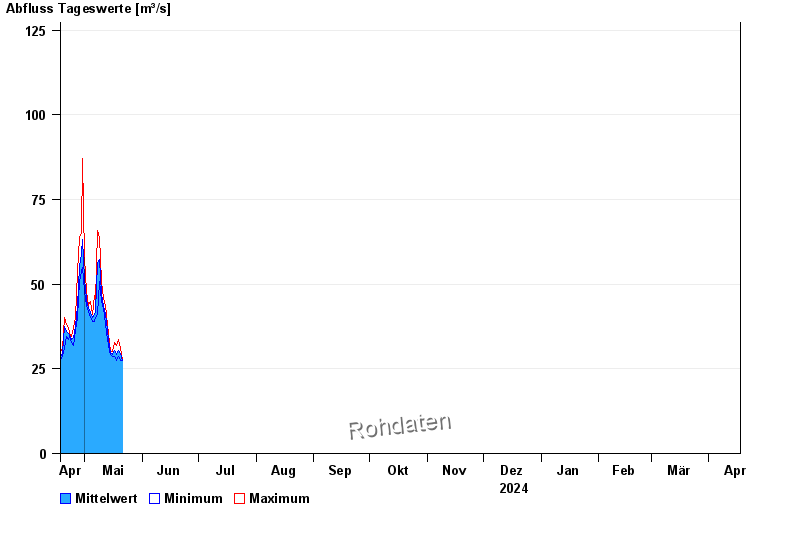
Chart of year Puppling / Isar
Discharge from 18.04.2024 to 17.04.2025
- 24.08.2005 Abfluss: 689 m³/s
- 22.05.1999 Abfluss: 592 m³/s
- 11.06.1965 Abfluss: 554 m³/s
- 23.07.1966 Abfluss: 550 m³/s
- 18.06.1979 Abfluss: 498 m³/s
| Date | Mean value [m³/s] | Maximum [m³/s] | Minimum [m³/s] |
|---|---|---|---|
| 30.04.2024 | 59.9 | 61.8 | 56.8 |
| 29.04.2024 | 59.1 | 64.9 | 53.8 |
| 28.04.2024 | 55.2 | 63.9 | 50.7 |
| 27.04.2024 | 43.4 | 53.8 | 40.1 |
| 26.04.2024 | 37.5 | 40.1 | 36.4 |
| 25.04.2024 | 34.2 | 37.3 | 31.9 |
| 24.04.2024 | 33.6 | 34.6 | 32.8 |
© Bayerisches Landesamt für Umwelt 2024