

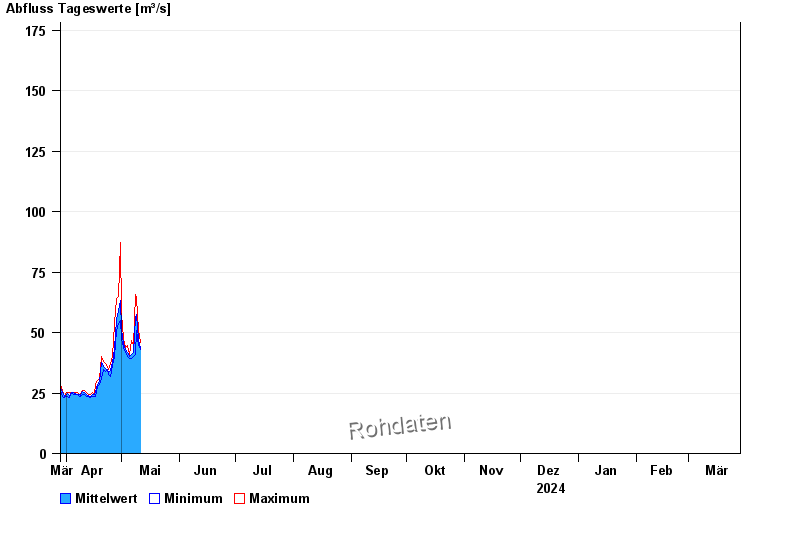
Chart of year Puppling / Isar
Discharge from 29.03.2024 to 28.03.2025
- HQ5 400 m³/s
- HQ10 470 m³/s
- HQ20 540 m³/s
- HQ100 690 m³/s
| Date | Mean value [m³/s] | Maximum [m³/s] | Minimum [m³/s] |
|---|---|---|---|
| 28.04.2024 | 56.4 | 56.8 | 54.8 |
| 27.04.2024 | 43.4 | 53.8 | 40.1 |
| 26.04.2024 | 37.5 | 40.1 | 36.4 |
| 25.04.2024 | 34.2 | 37.3 | 31.9 |
| 24.04.2024 | 33.6 | 34.6 | 32.8 |
| 23.04.2024 | 34.8 | 35.5 | 34.6 |
| 22.04.2024 | 35.3 | 37.3 | 33.7 |
© Bayerisches Landesamt für Umwelt 2024