

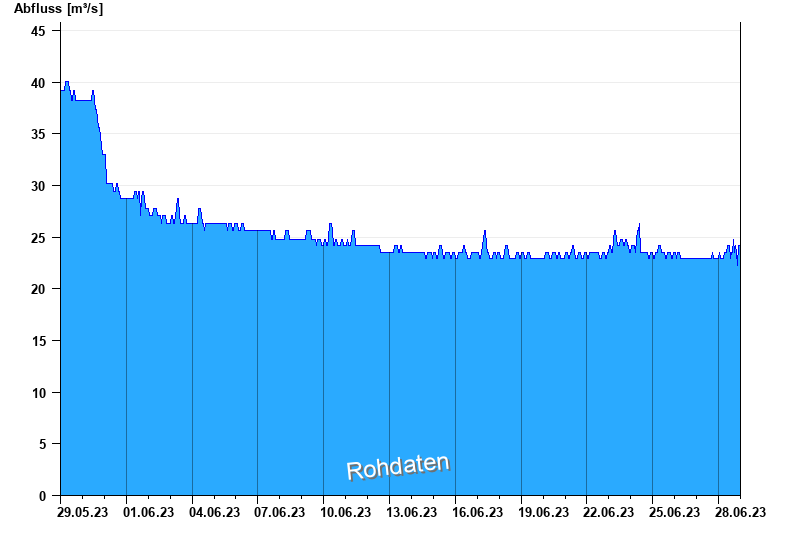
Chart of month Puppling / Isar
Discharge from 29.05.2023 to 28.06.2023
| Date | Runoff [m³/s] |
|---|---|
| 29.06.2023 00:45 | 22.9 |
| 29.06.2023 00:30 | 22.9 |
| 29.06.2023 00:15 | 23.5 |
| 29.06.2023 00:00 | 23.5 |
| 28.06.2023 23:45 | 23.5 |
| 28.06.2023 23:30 | 24.2 |
| 28.06.2023 23:15 | 24.2 |
© Bayerisches Landesamt für Umwelt 2025