
- Start >
- Rivers >
- Discharge >
- Bayern >
- Postmünster >
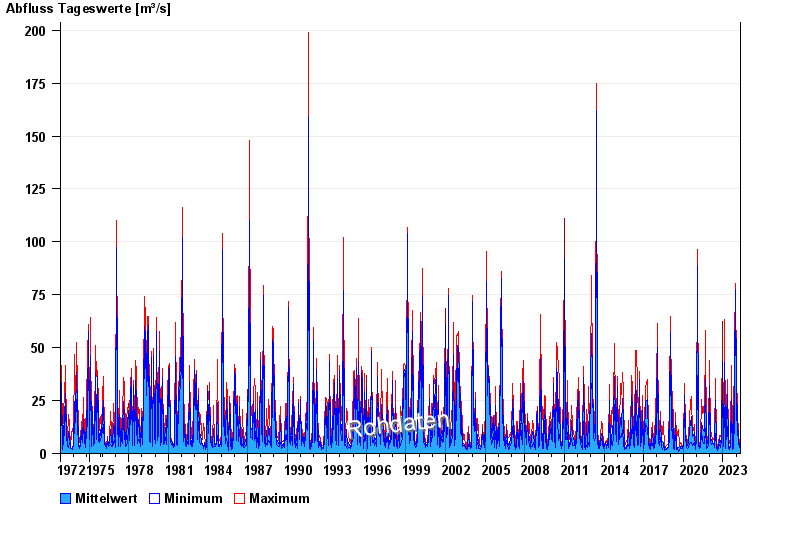
- Chart of total period

Chart of total period Postmünster / Rott
Discharge from 01.11.1972 to 01.05.2024
| Date | Mean value [m³/s] | Maximum [m³/s] | Minimum [m³/s] |
|---|---|---|---|
| 01.05.2024 | 1.88 | 1.88 | 1.88 |
| 30.04.2024 | 1.88 | 1.88 | 1.88 |
| 29.04.2024 | 2.03 | 2.19 | 1.88 |
| 28.04.2024 | 2.33 | 2.53 | 2.19 |
| 27.04.2024 | 2.53 | 2.53 | 2.53 |
| 26.04.2024 | 2.52 | 2.53 | 2.42 |
| 25.04.2024 | 2.83 | 5.21 | 1.78 |
© Bayerisches Landesamt für Umwelt 2024