

Chart of total period Pöttmes / Donaumoos Ach
Discharge from 01.11.1980 to 29.04.2024
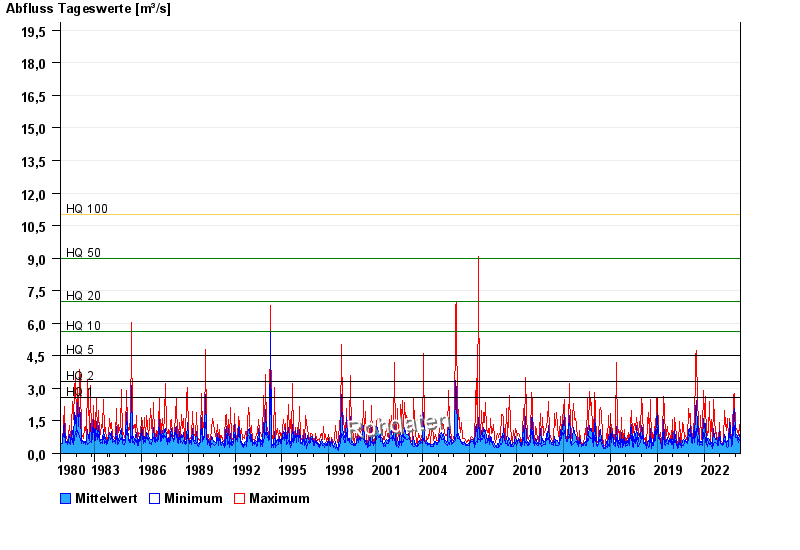
- HQ1 2,6 m³/s
- HQ2 3,3 m³/s
- HQ5 4,5 m³/s
- HQ10 5,6 m³/s
- HQ20 7 m³/s
- HQ50 9 m³/s
- HQ100 11 m³/s
| Date | Mean value [m³/s] | Maximum [m³/s] | Minimum [m³/s] |
|---|---|---|---|
| 29.04.2024 | 0.33 | 0.349 | 0.327 |
| 28.04.2024 | 0.353 | 0.397 | 0.327 |
| 27.04.2024 | 0.382 | 0.422 | 0.349 |
| 26.04.2024 | 0.421 | 0.476 | 0.372 |
| 25.04.2024 | 0.439 | 0.448 | 0.422 |
| 24.04.2024 | 0.456 | 0.503 | 0.422 |
| 23.04.2024 | 0.49 | 0.561 | 0.448 |
© Bayerisches Landesamt für Umwelt 2024