

Chart of year Piding / Stoißer Ache
Discharge from 01.01.2024 to 31.12.2024
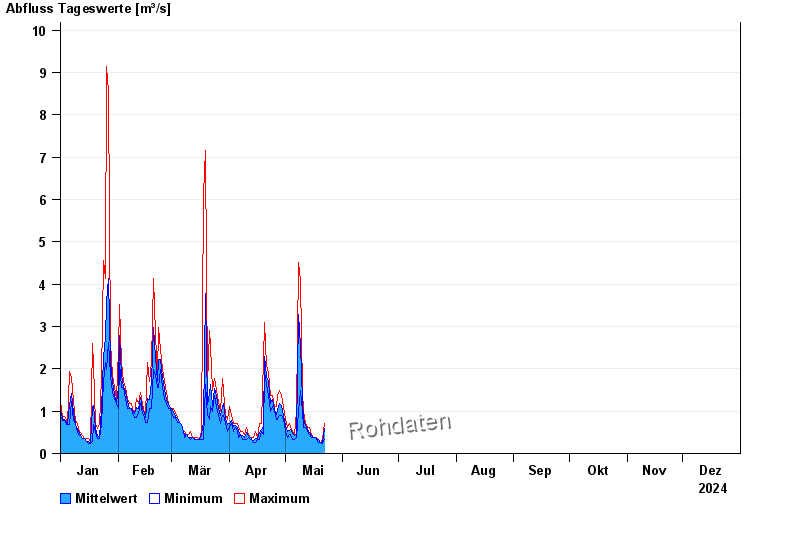
| Date | Mean value [m³/s] | Maximum [m³/s] | Minimum [m³/s] |
|---|---|---|---|
| 17.06.2024 | 1.13 | 1.23 | 0.992 |
| 16.06.2024 | 1.96 | 4.31 | 1.11 |
| 15.06.2024 | 1.2 | 1.35 | 1.11 |
| 14.06.2024 | 1.81 | 2.74 | 1.35 |
| 13.06.2024 | 2.25 | 6.16 | 0.992 |
| 12.06.2024 | 1.35 | 1.48 | 1.23 |
| 11.06.2024 | 1.65 | 2.23 | 1.35 |
© Bayerisches Landesamt für Umwelt 2024