

Chart of year Pfelling / Donau
Discharge from 01.01.2023 to 31.12.2023
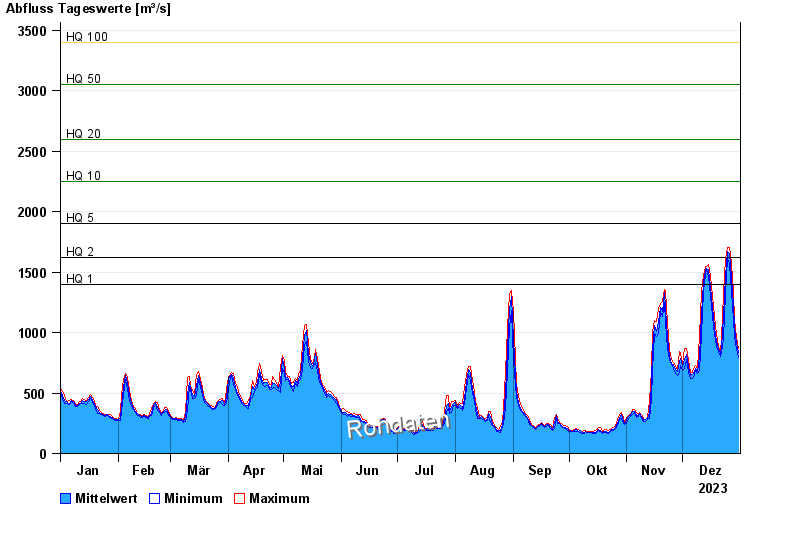
- HQ1 1400 m³/s
- HQ2 1620 m³/s
- HQ5 1900 m³/s
- HQ10 2250 m³/s
- HQ20 2600 m³/s
- HQ50 3050 m³/s
- HQ100 3400 m³/s
| Date | Mean value [m³/s] | Maximum [m³/s] | Minimum [m³/s] |
|---|---|---|---|
| 31.12.2023 | 834 | 865 | 790 |
| 30.12.2023 | 919 | 963 | 858 |
| 29.12.2023 | 1040 | 1110 | 963 |
| 28.12.2023 | 1220 | 1330 | 1110 |
| 27.12.2023 | 1460 | 1570 | 1330 |
| 26.12.2023 | 1650 | 1700 | 1570 |
| 25.12.2023 | 1670 | 1700 | 1610 |
© Bayerisches Landesamt für Umwelt 2024