

Chart of year Pfelling / Donau
Discharge from 01.01.2018 to 31.12.2018
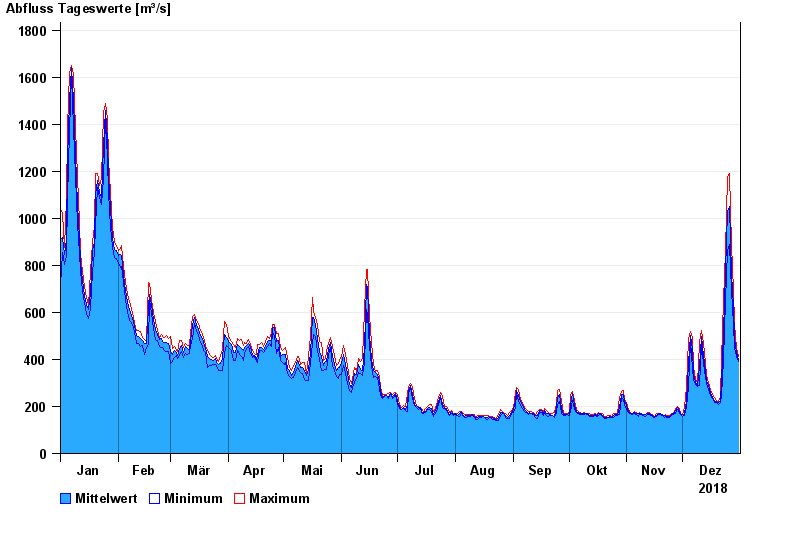
| Date | Mean value [m³/s] | Maximum [m³/s] | Minimum [m³/s] |
|---|---|---|---|
| 31.12.2018 | 398 | 413 | 391 |
| 30.12.2018 | 430 | 448 | 413 |
| 29.12.2018 | 489 | 550 | 448 |
| 28.12.2018 | 630 | 692 | 550 |
| 27.12.2018 | 762 | 888 | 692 |
| 26.12.2018 | 1050 | 1190 | 888 |
| 25.12.2018 | 1030 | 1180 | 862 |
© Bayerisches Landesamt für Umwelt 2024