

Chart of year Pfelling / Donau
Discharge from 31.03.2023 to 30.03.2024
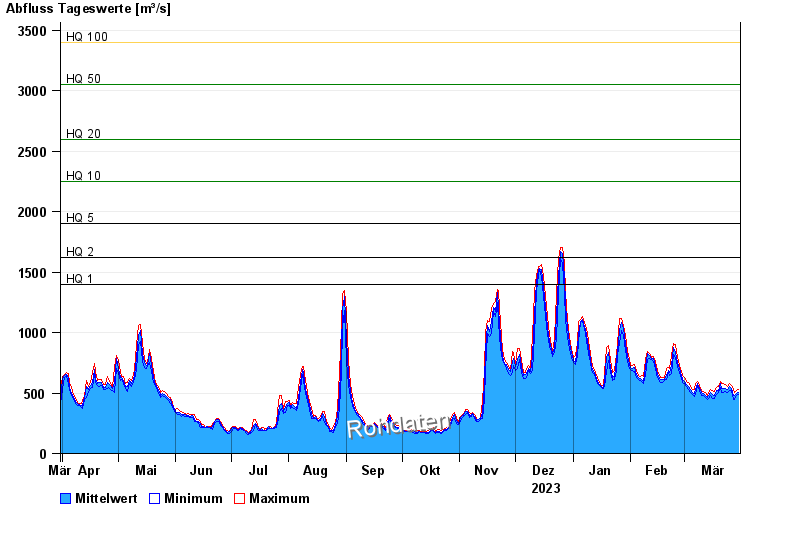
- HQ1 1400 m³/s
- HQ2 1620 m³/s
- HQ5 1900 m³/s
- HQ10 2250 m³/s
- HQ20 2600 m³/s
- HQ50 3050 m³/s
- HQ100 3400 m³/s
| Date | Mean value [m³/s] | Maximum [m³/s] | Minimum [m³/s] |
|---|---|---|---|
| 30.03.2024 | 508 | 528 | 487 |
| 29.03.2024 | 497 | 525 | 481 |
| 28.03.2024 | 480 | 505 | 445 |
| 27.03.2024 | 482 | 531 | 447 |
| 26.03.2024 | 540 | 560 | 519 |
| 25.03.2024 | 551 | 575 | 522 |
| 24.03.2024 | 529 | 557 | 508 |
© Bayerisches Landesamt für Umwelt 2024