

Chart of year Pfelling / Donau
Discharge from 27.01.2021 to 26.01.2022
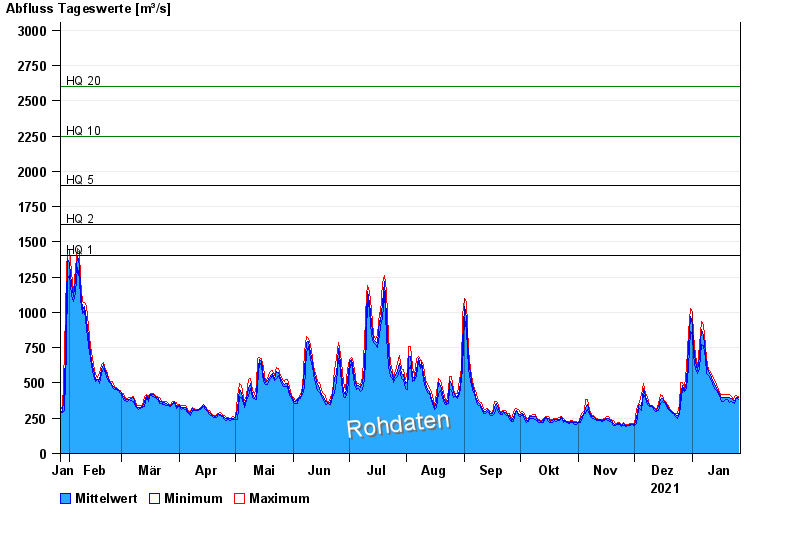
- HQ1 1400 m³/s
- HQ2 1620 m³/s
- HQ5 1900 m³/s
- HQ10 2250 m³/s
- HQ20 2600 m³/s
- HQ50 3050 m³/s
- HQ100 3400 m³/s
| Date | Mean value [m³/s] | Maximum [m³/s] | Minimum [m³/s] |
|---|---|---|---|
| 26.01.2022 | 396 | 403 | 385 |
| 25.01.2022 | 399 | 408 | 394 |
| 24.01.2022 | 376 | 406 | 357 |
| 23.01.2022 | 375 | 380 | 364 |
| 22.01.2022 | 391 | 406 | 370 |
| 21.01.2022 | 396 | 420 | 364 |
| 20.01.2022 | 399 | 418 | 380 |
© Bayerisches Landesamt für Umwelt 2024