
- Start >
- Rivers >
- Discharge >
- Bayern >
- Pfarrweisach >
- Chart of year

Chart of year Pfarrweisach / Weisach
Discharge from 01.01.2024 to 02.05.2024
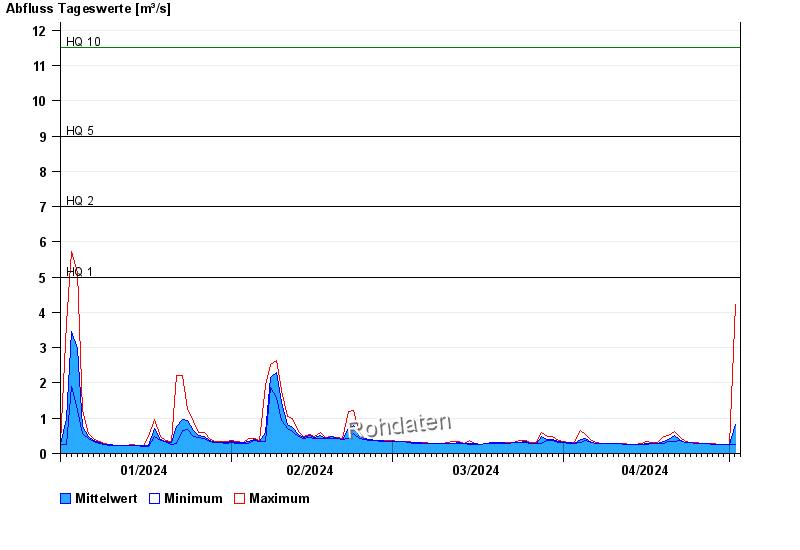
- HQ1 5 m³/s
- HQ2 7 m³/s
- HQ5 9 m³/s
- HQ10 11,5 m³/s
- HQ20 14,5 m³/s
- HQ50 18 m³/s
- HQ100 22 m³/s
| Date | Mean value [m³/s] | Maximum [m³/s] | Minimum [m³/s] |
|---|---|---|---|
| 02.05.2024 | 0.241 | 0.241 | 0.241 |
| 01.05.2024 | 0.241 | 0.241 | 0.241 |
| 30.04.2024 | 0.241 | 0.241 | 0.241 |
| 29.04.2024 | 0.242 | 0.256 | 0.241 |
| 28.04.2024 | 0.257 | 0.272 | 0.256 |
| 27.04.2024 | 0.272 | 0.272 | 0.272 |
| 26.04.2024 | 0.285 | 0.289 | 0.272 |
© Bayerisches Landesamt für Umwelt 2024