
- Start >
- Rivers >
- Discharge >
- Bayern >
- Peternerbrücke >
- Chart of year

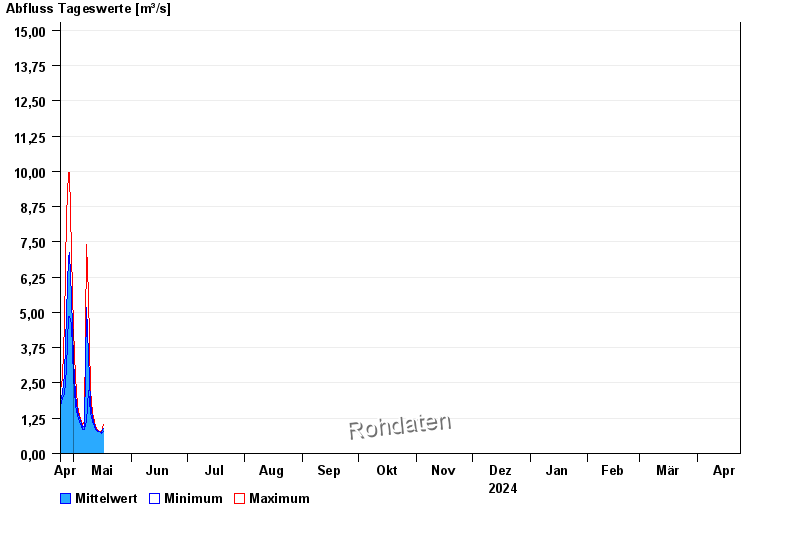
Chart of year Peternerbrücke / Jachen
Discharge from 24.04.2024 to 23.04.2025
- 23.08.2005 Abfluss: 156 m³/s
- 22.05.1999 Abfluss: 142 m³/s
- 03.06.2010 Abfluss: 95,8 m³/s
- 02.06.2013 Abfluss: 95,6 m³/s
- 29.07.2019 Abfluss: 84,3 m³/s
| Date | Mean value [m³/s] | Maximum [m³/s] | Minimum [m³/s] |
|---|---|---|---|
| 03.05.2024 | 1.58 | 1.69 | 1.45 |
| 02.05.2024 | 2.08 | 2.68 | 1.69 |
| 01.05.2024 | 3.28 | 4.38 | 2.68 |
| 30.04.2024 | 5.53 | 7.11 | 4.62 |
| 29.04.2024 | 7.14 | 9.95 | 4.86 |
| 28.04.2024 | 6.96 | 9.95 | 4.86 |
| 27.04.2024 | 4.95 | 8.45 | 3 |
© Bayerisches Landesamt für Umwelt 2024