
- Start >
- Rivers >
- Discharge >
- Bayern >
- Peternerbrücke >
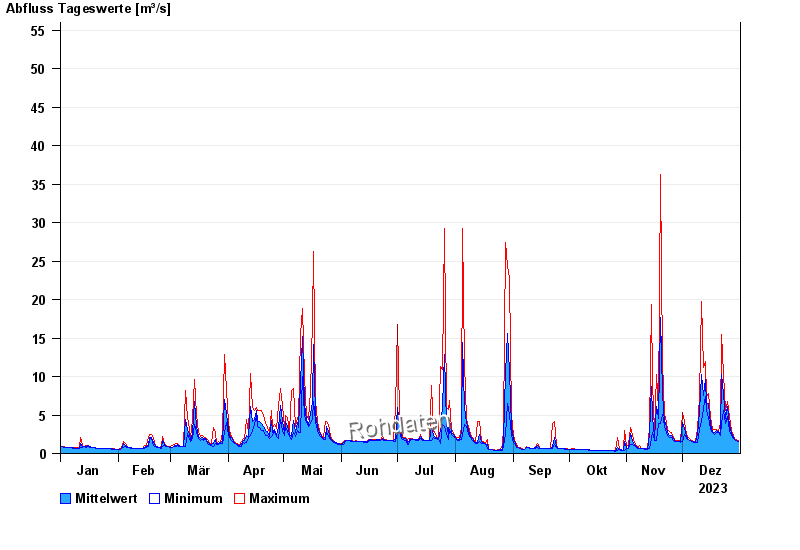
- Chart of year

Chart of year Peternerbrücke / Jachen
Discharge from 01.01.2023 to 31.12.2023
- 23.08.2005 Abfluss: 156 m³/s
- 22.05.1999 Abfluss: 142 m³/s
- 03.06.2010 Abfluss: 95,8 m³/s
- 02.06.2013 Abfluss: 95,6 m³/s
- 04.08.2020 Abfluss: 86,6 m³/s
| Date | Mean value [m³/s] | Maximum [m³/s] | Minimum [m³/s] |
|---|---|---|---|
| 31.12.2023 | 1.61 | 1.69 | 1.56 |
| 30.12.2023 | 1.75 | 1.81 | 1.69 |
| 29.12.2023 | 1.88 | 1.94 | 1.81 |
| 28.12.2023 | 2.1 | 2.37 | 1.94 |
| 27.12.2023 | 2.58 | 3 | 2.37 |
| 26.12.2023 | 3.61 | 4.86 | 3 |
| 25.12.2023 | 6.06 | 6.79 | 4.86 |
© Bayerisches Landesamt für Umwelt 2025