
- Start >
- Rivers >
- Discharge >
- Bayern >
- Peternerbrücke >
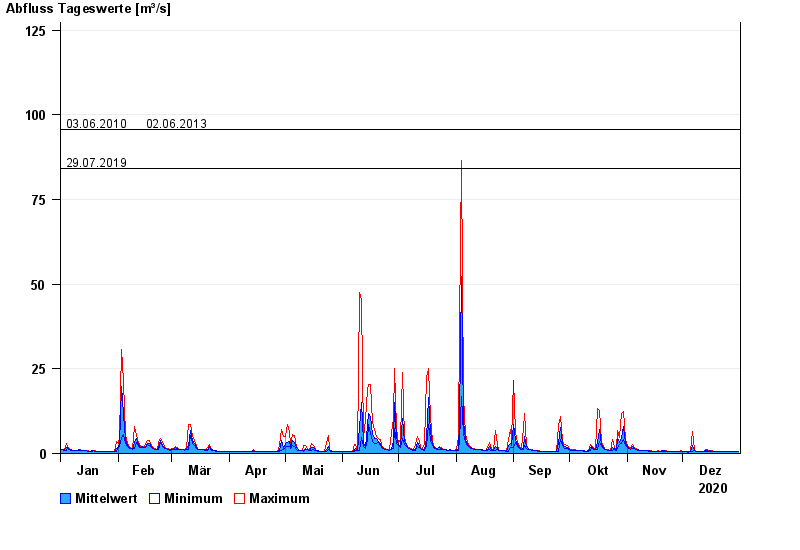
- Chart of year

Chart of year Peternerbrücke / Jachen
Discharge from 01.01.2020 to 31.12.2020
- 23.08.2005 Abfluss: 156 m³/s
- 22.05.1999 Abfluss: 142 m³/s
- 03.06.2010 Abfluss: 95,8 m³/s
- 02.06.2013 Abfluss: 95,6 m³/s
- 29.07.2019 Abfluss: 84,3 m³/s
| Date | Mean value [m³/s] | Maximum [m³/s] | Minimum [m³/s] |
|---|---|---|---|
| 31.12.2020 | 0.524 | 0.649 | 0.521 |
| 30.12.2020 | 0.576 | 0.584 | 0.522 |
| 29.12.2020 | 0.549 | 0.584 | 0.467 |
| 28.12.2020 | 0.546 | 0.585 | 0.523 |
| 27.12.2020 | 0.584 | 0.586 | 0.524 |
| 26.12.2020 | 0.586 | 0.587 | 0.586 |
| 25.12.2020 | 0.648 | 0.654 | 0.587 |
© Bayerisches Landesamt für Umwelt 2024