

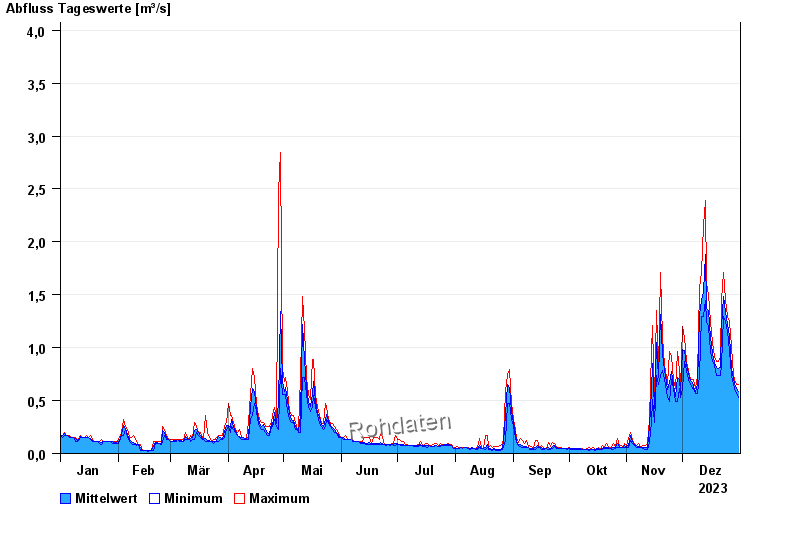
Chart of year Percha / Lüßbach
Discharge from 01.01.2023 to 31.12.2023
- 18.06.1979 Abfluss: 12,5 m³/s
- 19.07.1999 Abfluss: 8,92 m³/s
- 23.08.2005 Abfluss: 6,43 m³/s
- 22.05.1999 Abfluss: 6,26 m³/s
- 29.05.2007 Abfluss: 6,05 m³/s
| Date | Mean value [m³/s] | Maximum [m³/s] | Minimum [m³/s] |
|---|---|---|---|
| 31.12.2023 | 0.584 | 0.655 | 0.53 |
| 30.12.2023 | 0.612 | 0.655 | 0.571 |
| 29.12.2023 | 0.665 | 0.698 | 0.613 |
| 28.12.2023 | 0.705 | 0.741 | 0.655 |
| 27.12.2023 | 0.805 | 1.01 | 0.741 |
| 26.12.2023 | 1.11 | 1.25 | 0.966 |
| 25.12.2023 | 1.23 | 1.29 | 1.15 |
© Bayerisches Landesamt für Umwelt 2024