
- Start >
- Rivers >
- Discharge >
- Bayern >
- Peißenberg >
- Chart of year

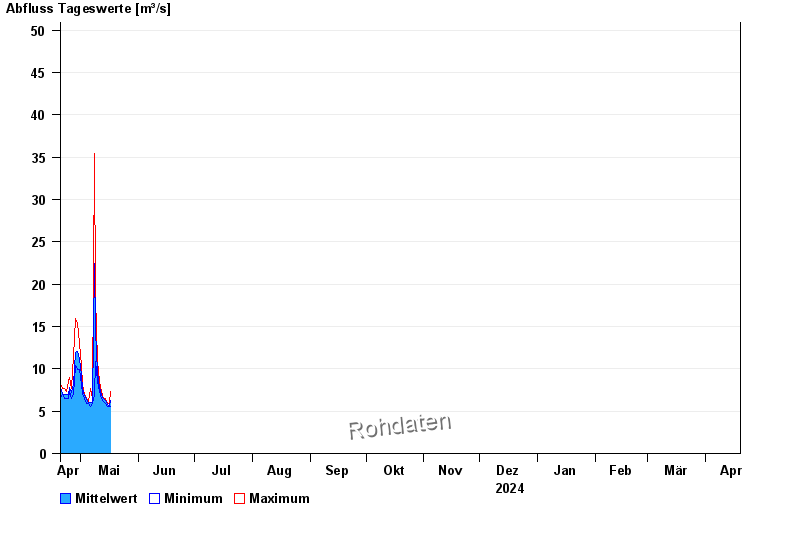
Chart of year Peißenberg / Ammer
Discharge from 20.04.2024 to 19.04.2025
- 22.05.1999 Abfluss: 435 m³/s
- 23.08.2005 Abfluss: 355 m³/s
- 10.08.1970 Abfluss: 264 m³/s
- 17.07.1993 Abfluss: 216 m³/s
- 02.06.2013 Abfluss: 205 m³/s
| Date | Mean value [m³/s] | Maximum [m³/s] | Minimum [m³/s] |
|---|---|---|---|
| 18.05.2024 | 6.78 | 6.94 | 6.55 |
| 17.05.2024 | 8.07 | 10.9 | 5.53 |
| 16.05.2024 | 5.57 | 5.86 | 5.53 |
| 15.05.2024 | 5.81 | 5.86 | 5.53 |
| 14.05.2024 | 6.24 | 6.55 | 5.86 |
| 13.05.2024 | 6.51 | 6.55 | 6.2 |
| 12.05.2024 | 6.87 | 7.31 | 6.55 |
© Bayerisches Landesamt für Umwelt 2024