

Chart of year Parsberg / Schwarze Laber
Discharge from 01.01.2024 to 31.12.2024
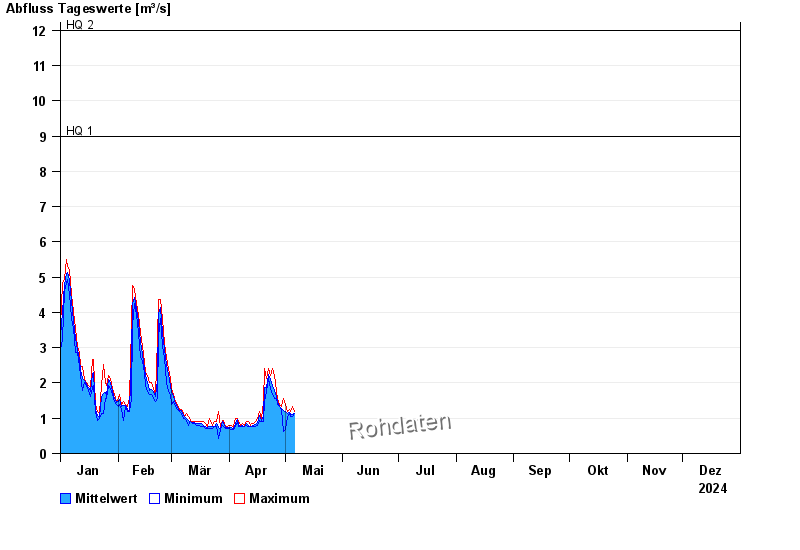
- HQ1 9 m³/s
- HQ2 12 m³/s
- HQ5 15,5 m³/s
- HQ10 19 m³/s
- HQ20 25 m³/s
- HQ50 36 m³/s
- HQ100 50 m³/s
| Date | Mean value [m³/s] | Maximum [m³/s] | Minimum [m³/s] |
|---|---|---|---|
| 15.05.2024 | 0.959 | 1.06 | 0.947 |
| 14.05.2024 | 0.982 | 1.06 | 0.947 |
| 13.05.2024 | 0.975 | 1.25 | 0.713 |
| 12.05.2024 | 0.997 | 1 | 0.947 |
| 11.05.2024 | 1.01 | 1.06 | 1 |
| 10.05.2024 | 1.04 | 1.12 | 1 |
| 09.05.2024 | 1.07 | 1.12 | 1 |
© Bayerisches Landesamt für Umwelt 2024