

Chart of year Panzing / Bina
Discharge from 08.12.2022 to 07.12.2023
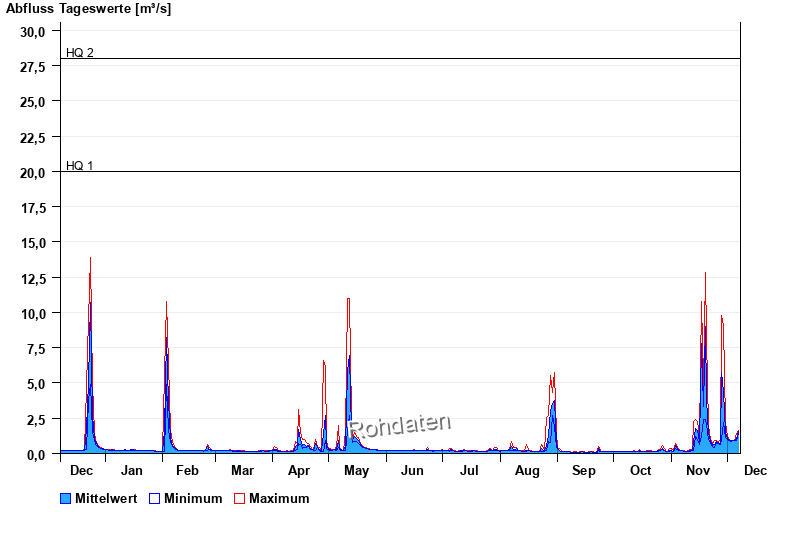
- HQ1 20 m³/s
- HQ2 28 m³/s
- HQ5 38 m³/s
- HQ10 46 m³/s
- HQ20 53 m³/s
- HQ50 64 m³/s
- HQ100 72 m³/s
| Date | Mean value [m³/s] | Maximum [m³/s] | Minimum [m³/s] |
|---|---|---|---|
| 07.12.2023 | 1.53 | 1.63 | 1.44 |
| 06.12.2023 | 1.04 | 1.44 | 0.939 |
| 05.12.2023 | 0.939 | 0.939 | 0.939 |
| 04.12.2023 | 0.939 | 0.939 | 0.939 |
| 03.12.2023 | 0.907 | 0.939 | 0.862 |
| 02.12.2023 | 0.992 | 1.01 | 0.939 |
| 01.12.2023 | 1.05 | 1.17 | 1.01 |
© Bayerisches Landesamt für Umwelt 2025