

Chart of year Offingen / Mindel
Discharge from 01.01.2024 to 29.04.2024
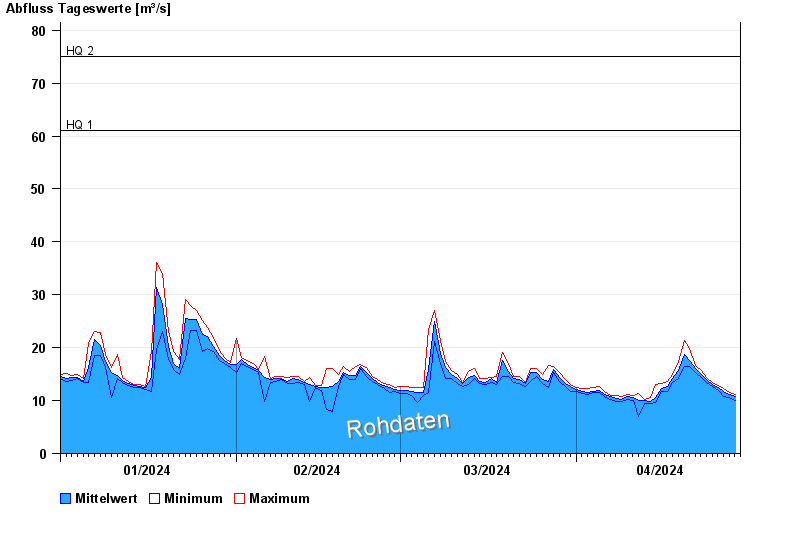
- HQ1 61 m³/s
- HQ2 75 m³/s
- HQ5 95 m³/s
- HQ10 110 m³/s
- HQ20 120 m³/s
- HQ50 135 m³/s
- HQ100 150 m³/s
| Date | Mean value [m³/s] | Maximum [m³/s] | Minimum [m³/s] |
|---|---|---|---|
| 29.04.2024 | 10.9 | 11.1 | 10.8 |
| 28.04.2024 | 11.1 | 11.5 | 10.5 |
| 27.04.2024 | 11.7 | 12.2 | 10.8 |
| 26.04.2024 | 12.4 | 12.9 | 12 |
| 25.04.2024 | 13.1 | 13.5 | 12.6 |
| 24.04.2024 | 13.9 | 14.4 | 13.5 |
| 23.04.2024 | 14.9 | 15.7 | 14.4 |
© Bayerisches Landesamt für Umwelt 2024