

Chart of year Ösbühl / Danglesbach
Discharge from 01.01.2024 to 29.04.2024
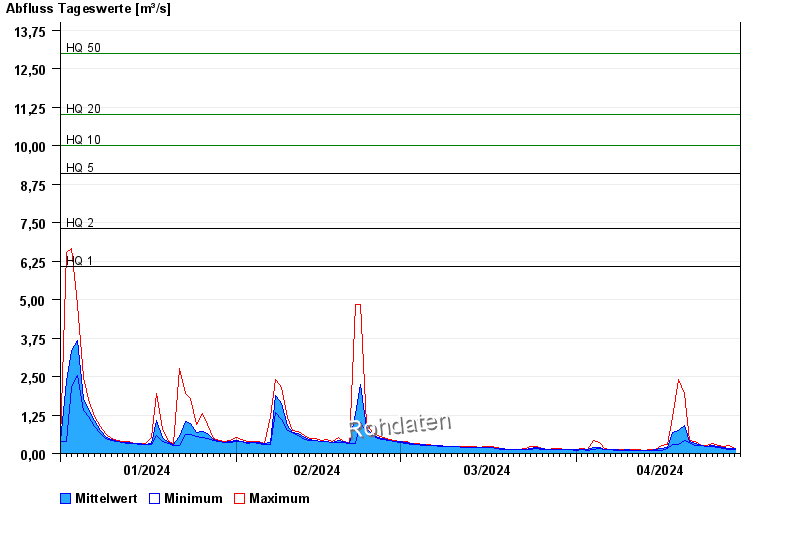
- HQ1 6,06 m³/s
- HQ2 7,3 m³/s
- HQ5 9,1 m³/s
- HQ10 10 m³/s
- HQ20 11 m³/s
- HQ50 13 m³/s
- HQ100 14 m³/s
| Date | Mean value [m³/s] | Maximum [m³/s] | Minimum [m³/s] |
|---|---|---|---|
| 29.04.2024 | 0.157 | 0.17 | 0.144 |
| 28.04.2024 | 0.175 | 0.259 | 0.144 |
| 27.04.2024 | 0.19 | 0.214 | 0.17 |
| 26.04.2024 | 0.218 | 0.244 | 0.199 |
| 25.04.2024 | 0.262 | 0.325 | 0.228 |
| 24.04.2024 | 0.243 | 0.259 | 0.228 |
| 23.04.2024 | 0.265 | 0.275 | 0.244 |
© Bayerisches Landesamt für Umwelt 2024