

Chart of total period Obersdorf / Rosenbach
Discharge from 01.11.1953 to 30.04.2024
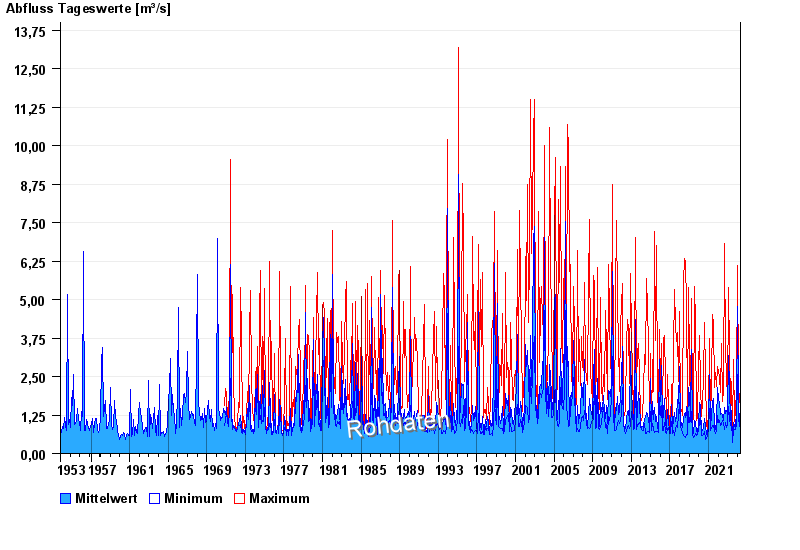
| Date | Mean value [m³/s] | Maximum [m³/s] | Minimum [m³/s] |
|---|---|---|---|
| 30.04.2024 | 0.9 | 0.914 | 0.87 |
| 29.04.2024 | 0.898 | 0.914 | 0.87 |
| 28.04.2024 | 0.898 | 0.914 | 0.87 |
| 27.04.2024 | 0.917 | 0.958 | 0.87 |
| 26.04.2024 | 0.941 | 0.958 | 0.914 |
| 25.04.2024 | 0.99 | 1.09 | 0.87 |
| 24.04.2024 | 0.938 | 0.958 | 0.914 |
© Bayerisches Landesamt für Umwelt 2024