

Chart of year Oberndorf / Donau
Discharge from 23.03.2024 to 22.03.2025
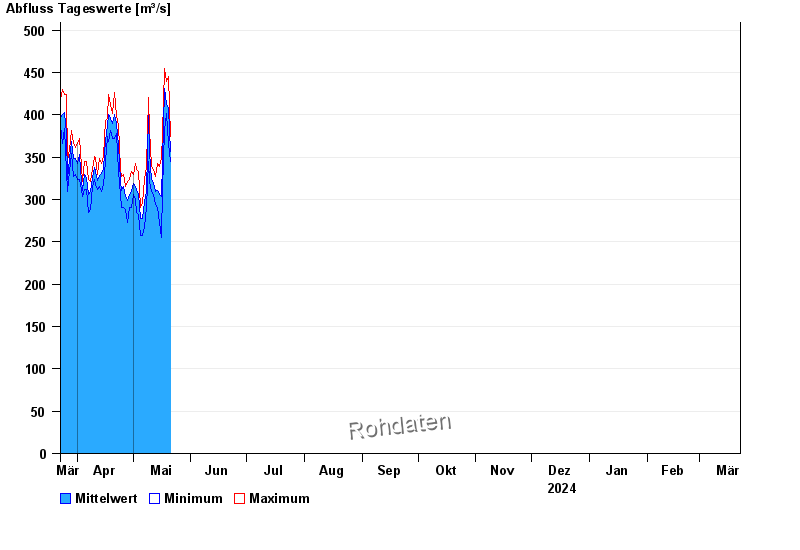
| Date | Mean value [m³/s] | Maximum [m³/s] | Minimum [m³/s] |
|---|---|---|---|
| 01.05.2024 | 315 | 318 | 312 |
| 30.04.2024 | 309 | 333 | 291 |
| 29.04.2024 | 306 | 324 | 291 |
| 28.04.2024 | 299 | 321 | 273 |
| 27.04.2024 | 304 | 315 | 288 |
| 26.04.2024 | 315 | 330 | 291 |
| 25.04.2024 | 311 | 327 | 291 |
© Bayerisches Landesamt für Umwelt 2024