

Chart of year Oberndorf / Donau
Discharge from 01.01.2022 to 31.12.2022
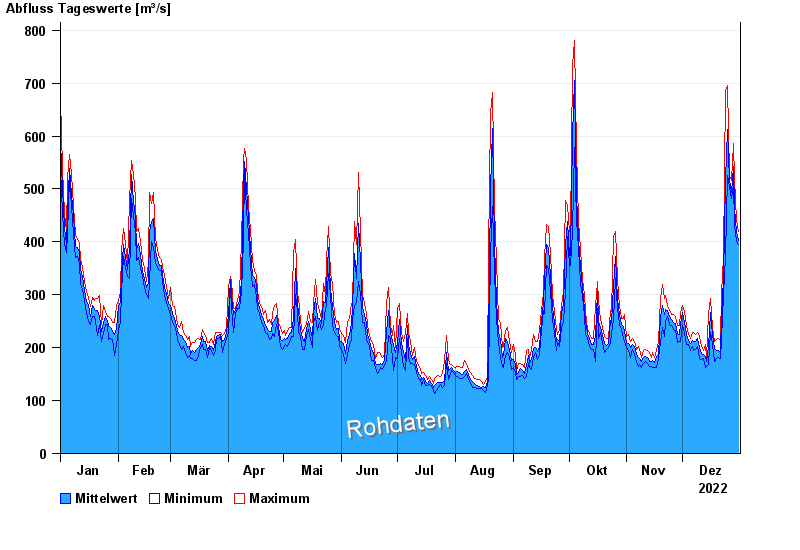
| Date | Mean value [m³/s] | Maximum [m³/s] | Minimum [m³/s] |
|---|---|---|---|
| 31.12.2022 | 403 | 419 | 395 |
| 30.12.2022 | 418 | 441 | 401 |
| 29.12.2022 | 464 | 519 | 432 |
| 28.12.2022 | 543 | 585 | 509 |
| 27.12.2022 | 493 | 516 | 481 |
| 26.12.2022 | 516 | 525 | 503 |
| 25.12.2022 | 613 | 695 | 525 |
© Bayerisches Landesamt für Umwelt 2024