

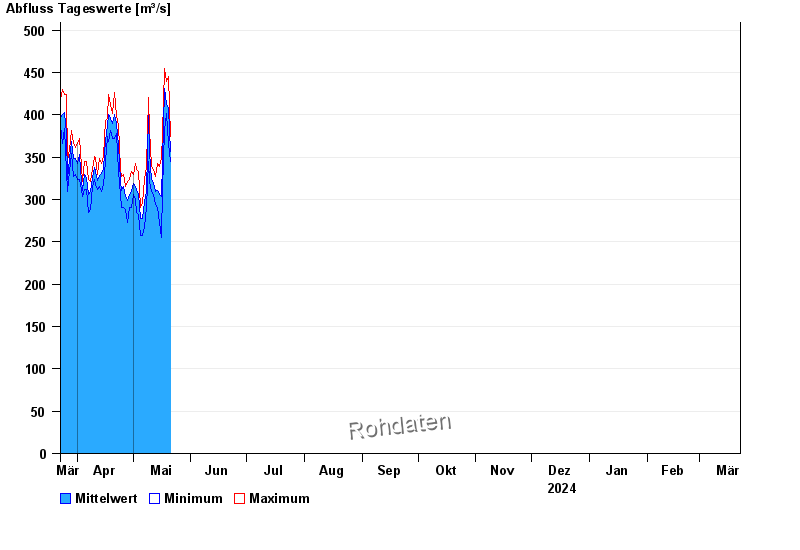
Chart of year Oberndorf / Donau
Discharge from 23.03.2024 to 22.03.2025
| Date | Mean value [m³/s] | Maximum [m³/s] | Minimum [m³/s] |
|---|---|---|---|
| 15.06.2024 | 622 | 633 | 609 |
| 14.06.2024 | 675 | 716 | 627 |
| 13.06.2024 | 766 | 837 | 713 |
| 12.06.2024 | 908 | 999 | 837 |
| 11.06.2024 | 1070 | 1110 | 1000 |
| 10.06.2024 | 1050 | 1060 | 1030 |
| 09.06.2024 | 1080 | 1140 | 1040 |
© Bayerisches Landesamt für Umwelt 2024