

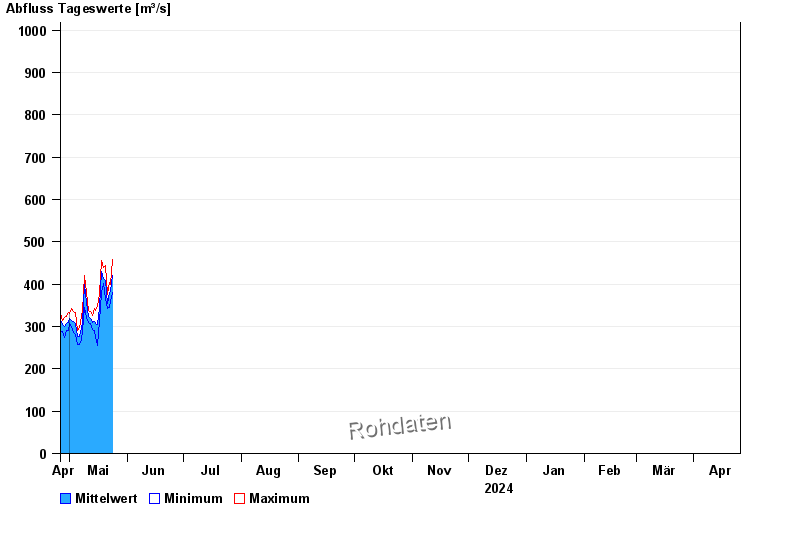
Chart of year Oberndorf / Donau
Discharge from 26.04.2024 to 25.04.2025
- HQ1 1100 m³/s
- HQ2 1260 m³/s
- HQ5 1450 m³/s
- HQ10 1680 m³/s
- HQ20 1900 m³/s
- HQ50 2150 m³/s
- HQ100 2350 m³/s
| Date | Mean value [m³/s] | Maximum [m³/s] | Minimum [m³/s] |
|---|---|---|---|
| 05.05.2024 | 286 | 288 | 285 |
| 04.05.2024 | 306 | 333 | 282 |
| 03.05.2024 | 312 | 336 | 285 |
| 02.05.2024 | 315 | 342 | 300 |
| 01.05.2024 | 319 | 330 | 306 |
| 30.04.2024 | 309 | 333 | 291 |
| 29.04.2024 | 306 | 324 | 291 |
© Bayerisches Landesamt für Umwelt 2024