

Chart of year Oberndorf / Donau
Discharge from 01.01.2023 to 31.12.2023
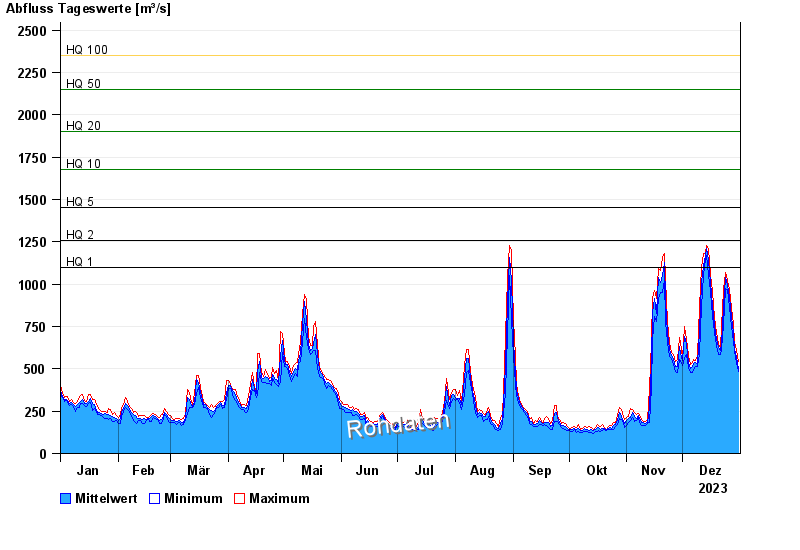
- HQ1 1100 m³/s
- HQ2 1260 m³/s
- HQ5 1450 m³/s
- HQ10 1680 m³/s
- HQ20 1900 m³/s
- HQ50 2150 m³/s
- HQ100 2350 m³/s
| Date | Mean value [m³/s] | Maximum [m³/s] | Minimum [m³/s] |
|---|---|---|---|
| 31.12.2023 | 504 | 543 | 486 |
| 30.12.2023 | 567 | 606 | 536 |
| 29.12.2023 | 623 | 659 | 600 |
| 28.12.2023 | 707 | 759 | 662 |
| 27.12.2023 | 802 | 863 | 753 |
| 26.12.2023 | 924 | 971 | 863 |
| 25.12.2023 | 993 | 1020 | 969 |
© Bayerisches Landesamt für Umwelt 2024