

Chart of year Oberndorf / Donau
Discharge from 01.01.2021 to 31.12.2021
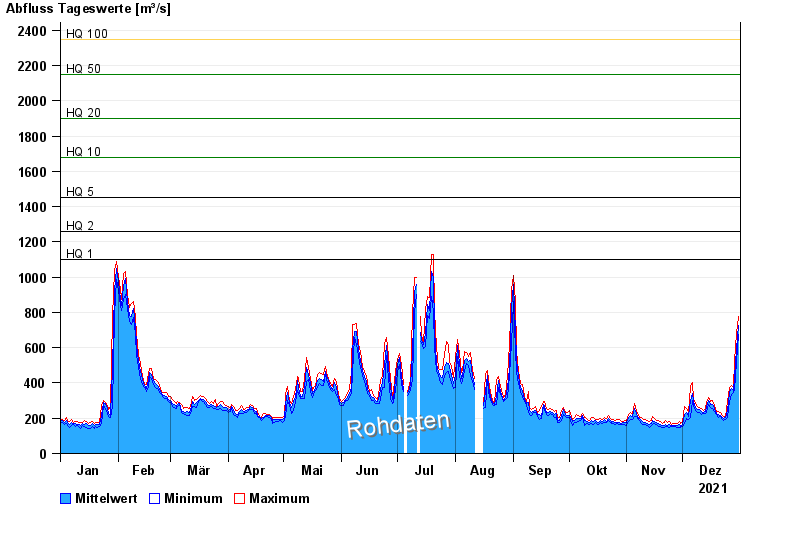
- HQ1 1100 m³/s
- HQ2 1260 m³/s
- HQ5 1450 m³/s
- HQ10 1680 m³/s
- HQ20 1900 m³/s
- HQ50 2150 m³/s
- HQ100 2350 m³/s
| Date | Mean value [m³/s] | Maximum [m³/s] | Minimum [m³/s] |
|---|---|---|---|
| 31.12.2021 | 724 | 774 | 674 |
| 30.12.2021 | 591 | 680 | 516 |
| 29.12.2021 | 433 | 519 | 364 |
| 28.12.2021 | 358 | 373 | 346 |
| 27.12.2021 | 366 | 383 | 337 |
| 26.12.2021 | 344 | 377 | 295 |
| 25.12.2021 | 243 | 295 | 203 |
© Bayerisches Landesamt für Umwelt 2024