

Chart of year Obernach / Ach
Discharge from 03.12.2022 to 02.12.2023
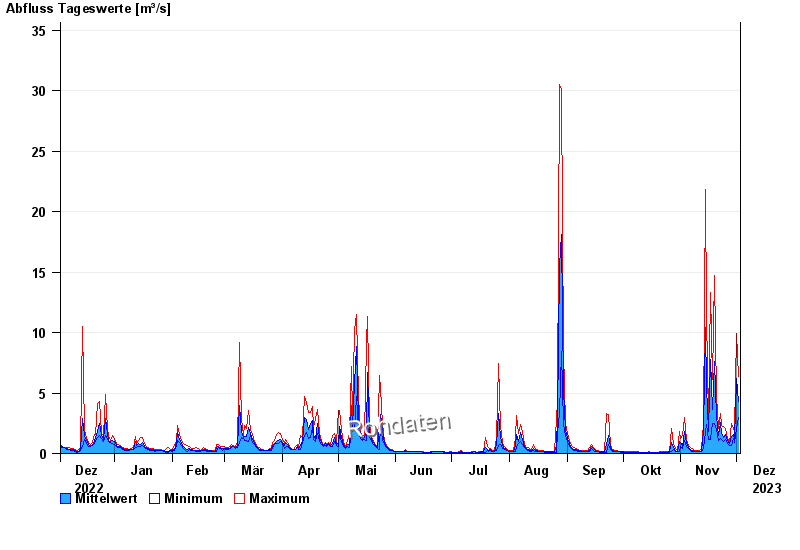
| Date | Mean value [m³/s] | Maximum [m³/s] | Minimum [m³/s] |
|---|---|---|---|
| 02.12.2023 | 4.26 | 6.4 | 2.95 |
| 01.12.2023 | 6.24 | 9.96 | 2.1 |
| 30.11.2023 | 1.14 | 1.81 | 0.899 |
| 29.11.2023 | 1.55 | 2.06 | 1.22 |
| 28.11.2023 | 1.42 | 2.51 | 0.668 |
| 27.11.2023 | 0.791 | 0.899 | 0.668 |
| 26.11.2023 | 1.04 | 1.22 | 0.84 |
© Bayerisches Landesamt für Umwelt 2024