
- Start >
- Rivers >
- Discharge >
- Bayern >
- Obermühlhausen >
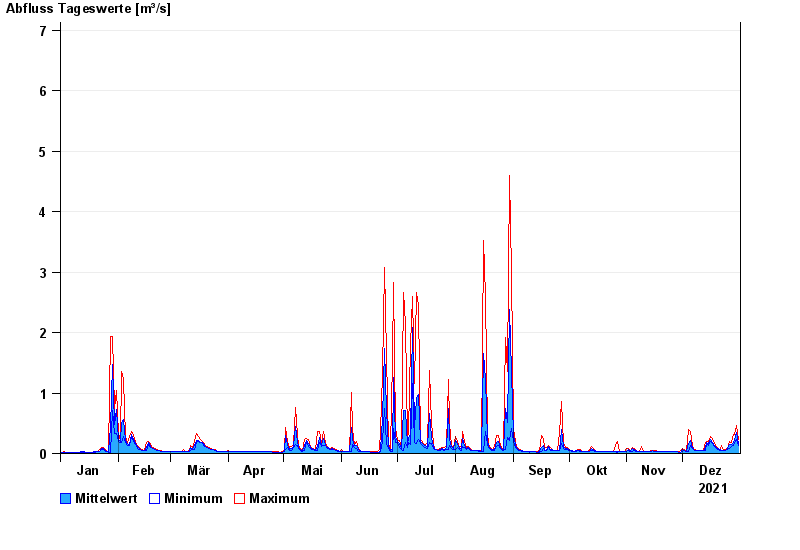
- Chart of year

Chart of year Obermühlhausen / Beurerbach
Discharge from 01.01.2021 to 31.12.2021
- 06.08.2000 Abfluss: 9,54 m³/s
- 21.05.1999 Abfluss: 8,36 m³/s
- 21.09.2000 Abfluss: 7,97 m³/s
- 30.06.2011 Abfluss: 7,15 m³/s
- 29.05.2007 Abfluss: 7,05 m³/s
| Date | Mean value [m³/s] | Maximum [m³/s] | Minimum [m³/s] |
|---|---|---|---|
| 31.12.2021 | 0.171 | 0.23 | 0.138 |
| 30.12.2021 | 0.346 | 0.468 | 0.23 |
| 29.12.2021 | 0.215 | 0.311 | 0.159 |
| 28.12.2021 | 0.183 | 0.311 | 0.138 |
| 27.12.2021 | 0.152 | 0.181 | 0.118 |
| 26.12.2021 | 0.151 | 0.205 | 0.082 |
| 25.12.2021 | 0.081 | 0.082 | 0.067 |
© Bayerisches Landesamt für Umwelt 2024