
- Start >
- Rivers >
- Discharge >
- Bayern >
- Obermühlhausen >
- Chart of year

Chart of year Obermühlhausen / Windach
Discharge from 21.08.2023 to 20.08.2024
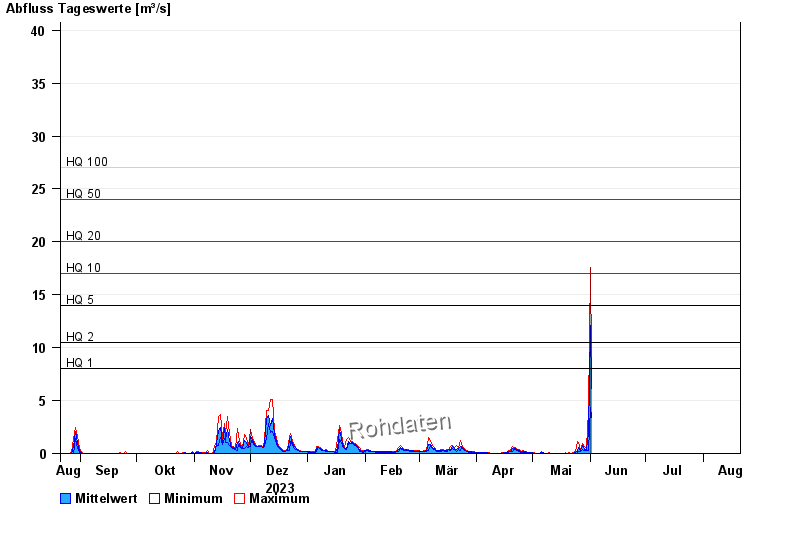
- HQ1 8 m³/s
- HQ2 10,5 m³/s
- HQ5 14 m³/s
- HQ10 17 m³/s
- HQ20 20 m³/s
- HQ50 24 m³/s
- HQ100 27 m³/s
| Date | Mean value [m³/s] | Maximum [m³/s] | Minimum [m³/s] |
|---|---|---|---|
| 09.05.2024 | 0.029 | 0.033 | 0.016 |
| 08.05.2024 | 0.027 | 0.033 | 0.016 |
| 07.05.2024 | 0.067 | 0.123 | 0.024 |
| 06.05.2024 | 0.05 | 0.15 | 0.024 |
| 05.05.2024 | 0.035 | 0.045 | 0.024 |
| 04.05.2024 | 0.036 | 0.045 | 0.024 |
| 03.05.2024 | 0.033 | 0.045 | 0.024 |
© Bayerisches Landesamt für Umwelt 2024