
- Start >
- Rivers >
- Discharge >
- Bayern >
- Obermühlhausen >
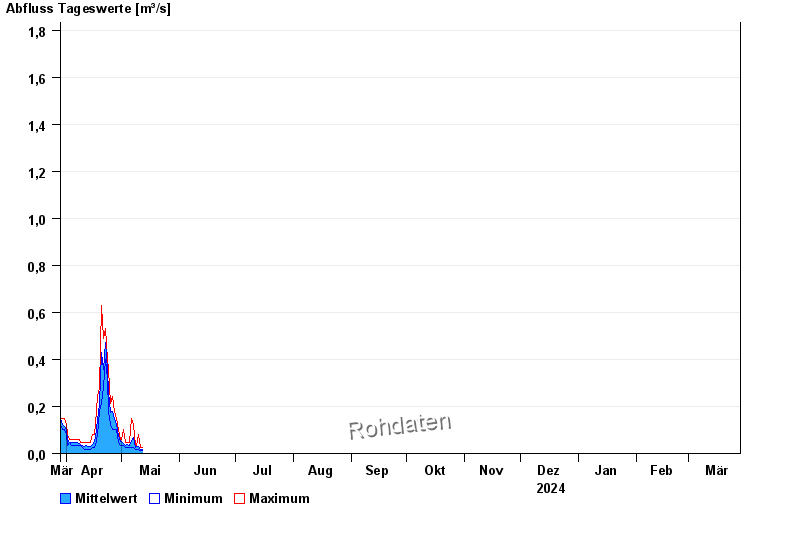
- Chart of year

Chart of year Obermühlhausen / Windach
Discharge from 29.03.2024 to 28.03.2025
- HQ1 8 m³/s
- HQ2 10,5 m³/s
- HQ5 14 m³/s
- HQ10 17 m³/s
- HQ20 20 m³/s
- HQ50 24 m³/s
- HQ100 27 m³/s
| Date | Mean value [m³/s] | Maximum [m³/s] | Minimum [m³/s] |
|---|---|---|---|
| 28.04.2024 | 0.1 | 0.123 | 0.079 |
| 27.04.2024 | 0.149 | 0.179 | 0.1 |
| 26.04.2024 | 0.18 | 0.244 | 0.1 |
| 25.04.2024 | 0.174 | 0.211 | 0.123 |
| 24.04.2024 | 0.26 | 0.358 | 0.179 |
| 23.04.2024 | 0.357 | 0.4 | 0.318 |
| 22.04.2024 | 0.474 | 0.533 | 0.4 |
© Bayerisches Landesamt für Umwelt 2024