
- Start >
- Rivers >
- Discharge >
- Bayern >
- Oberaudorf >
- Chart of year

Chart of year Oberaudorf / Inn
Discharge from 01.01.2020 to 31.12.2020
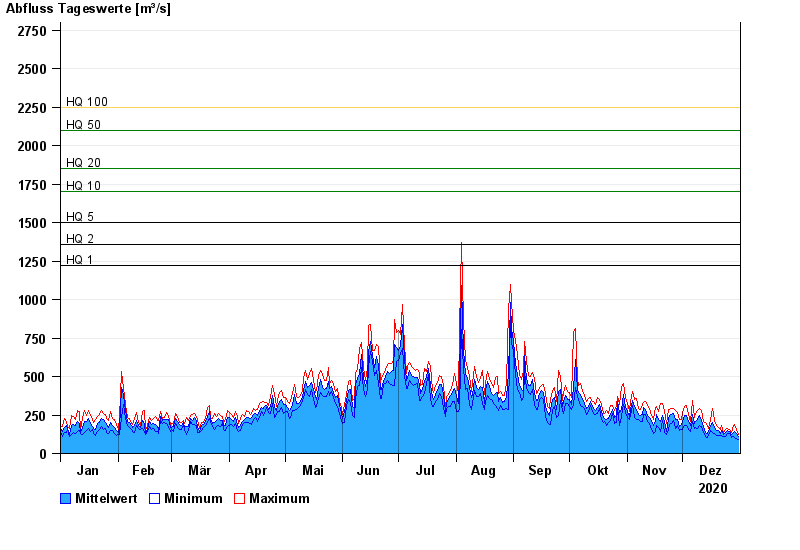
- HQ1 1220 m³/s
- HQ2 1360 m³/s
- HQ5 1500 m³/s
- HQ10 1700 m³/s
- HQ20 1850 m³/s
- HQ50 2100 m³/s
- HQ100 2250 m³/s
| Date | Mean value [m³/s] | Maximum [m³/s] | Minimum [m³/s] |
|---|---|---|---|
| 31.12.2020 | 110 | 123 | 93.9 |
| 30.12.2020 | 132 | 157 | 97.5 |
| 29.12.2020 | 140 | 191 | 105 |
| 28.12.2020 | 138 | 183 | 109 |
| 27.12.2020 | 123 | 135 | 105 |
| 26.12.2020 | 141 | 157 | 127 |
| 25.12.2020 | 149 | 161 | 131 |
© Bayerisches Landesamt für Umwelt 2024