
- Start >
- Rivers >
- Discharge >
- Bayern >
- Oberammergau >
- Chart of year

Chart of year Oberammergau / Ammer
Discharge from 01.01.2024 to 30.04.2024
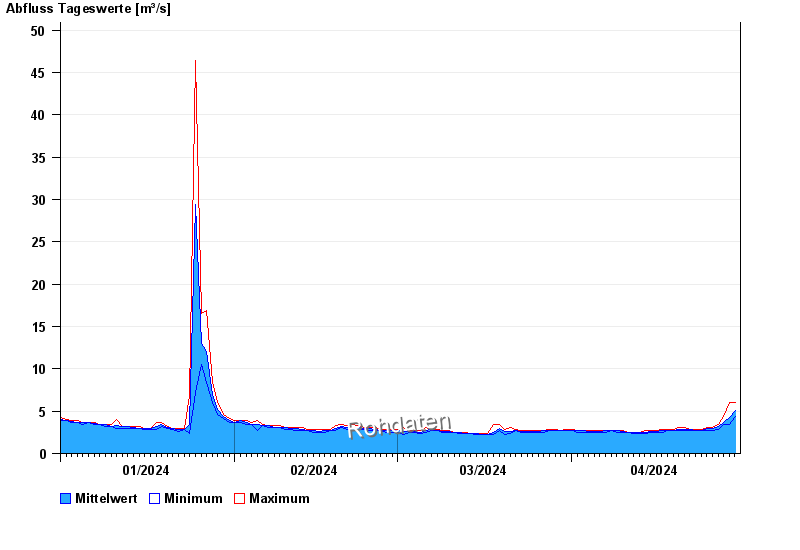
| Date | Mean value [m³/s] | Maximum [m³/s] | Minimum [m³/s] |
|---|---|---|---|
| 30.04.2024 | 5.58 | 6 | 5.18 |
| 29.04.2024 | 4.2 | 6 | 3.47 |
| 28.04.2024 | 3.68 | 4.4 | 3.47 |
| 27.04.2024 | 3.14 | 3.47 | 2.87 |
| 26.04.2024 | 2.91 | 3.06 | 2.68 |
| 25.04.2024 | 2.9 | 3.06 | 2.68 |
| 24.04.2024 | 2.75 | 2.87 | 2.68 |
© Bayerisches Landesamt für Umwelt 2024