

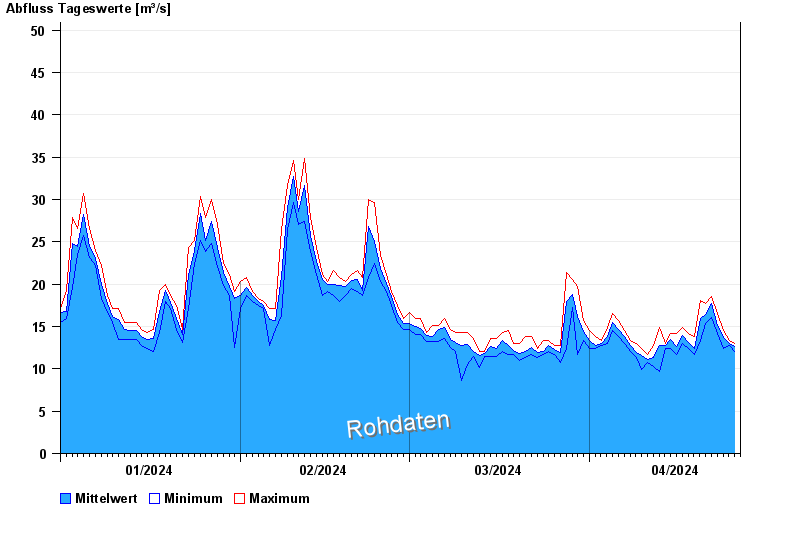
Chart of year Neumühle / Rednitz
Discharge from 01.01.2024 to 26.04.2024
- 23.02.1970 Abfluss: 266 m³/s
- 03.03.1987 Abfluss: 255 m³/s
- 30.07.1924 Abfluss: 250 m³/s
- 11.11.1927 Abfluss: 242 m³/s
- 14.04.1994 Abfluss: 237 m³/s
| Date | Mean value [m³/s] | Maximum [m³/s] | Minimum [m³/s] |
|---|---|---|---|
| 26.04.2024 | 12.7 | 13 | 12 |
| 25.04.2024 | 13 | 13.4 | 12.7 |
| 24.04.2024 | 13.7 | 14.5 | 12.4 |
| 23.04.2024 | 15.1 | 16.5 | 14.2 |
| 22.04.2024 | 17.7 | 18.5 | 16.1 |
| 21.04.2024 | 16.4 | 17.7 | 15.3 |
| 20.04.2024 | 16 | 18.1 | 13.4 |
© Bayerisches Landesamt für Umwelt 2024