

Chart of total period Mering / Paar
Discharge from 01.11.1984 to 09.05.2024
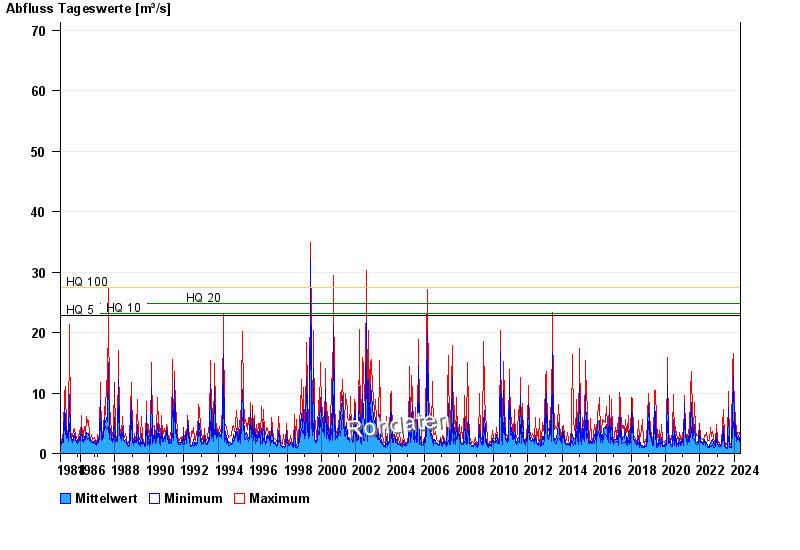
- HQ5 22,8 m³/s
- HQ10 23,2 m³/s
- HQ20 24,8 m³/s
- HQ100 27,4 m³/s
| Date | Mean value [m³/s] | Maximum [m³/s] | Minimum [m³/s] |
|---|---|---|---|
| 09.05.2024 | 1.98 | 2.01 | 1.82 |
| 08.05.2024 | 1.93 | 2.01 | 1.82 |
| 07.05.2024 | 2.01 | 2.45 | 1.21 |
| 06.05.2024 | 2.08 | 3.77 | 1.82 |
| 05.05.2024 | 1.82 | 1.82 | 1.64 |
| 04.05.2024 | 1.81 | 2.01 | 1.47 |
| 03.05.2024 | 1.84 | 2.01 | 1.64 |
© Bayerisches Landesamt für Umwelt 2024