
- Start >
- Rivers >
- Discharge >
- Bayern >
- Marktredwitz >
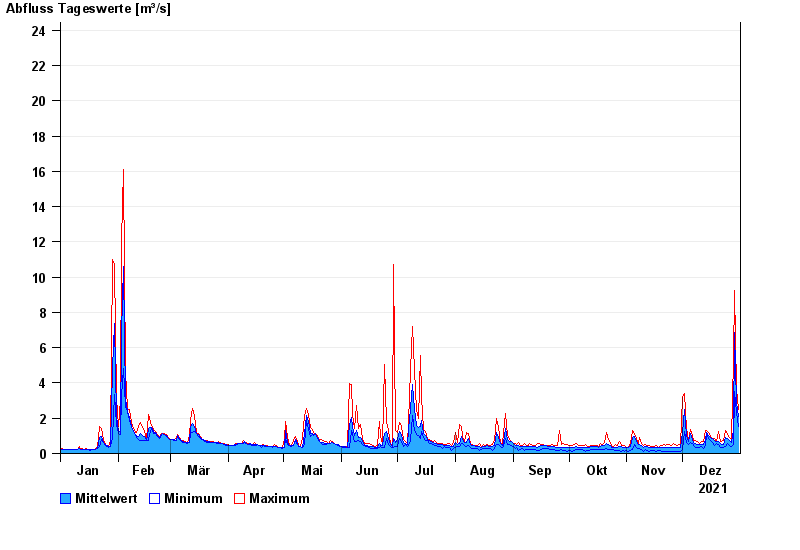
- Chart of year

Chart of year Marktredwitz / Kössein
Discharge from 01.01.2021 to 31.12.2021
- 29.06.2006 Abfluss: 27,9 m³/s
- 01.11.1998 Abfluss: 27,6 m³/s
- 12.02.2005 Abfluss: 27 m³/s
- 26.01.1995 Abfluss: 25,8 m³/s
- 04.12.1988 Abfluss: 24,3 m³/s
| Date | Mean value [m³/s] | Maximum [m³/s] | Minimum [m³/s] |
|---|---|---|---|
| 31.12.2021 | 2.09 | 2.5 | 1.68 |
| 30.12.2021 | 2.9 | 3.68 | 2.5 |
| 29.12.2021 | 6.86 | 9.26 | 3.79 |
| 28.12.2021 | 1.36 | 5.32 | 0.62 |
| 27.12.2021 | 0.65 | 0.846 | 0.501 |
| 26.12.2021 | 0.716 | 0.899 | 0.539 |
| 25.12.2021 | 0.876 | 1.06 | 0.663 |
© Bayerisches Landesamt für Umwelt 2024