
- Start >
- Rivers >
- Discharge >
- Bayern >
- Marktredwitz >
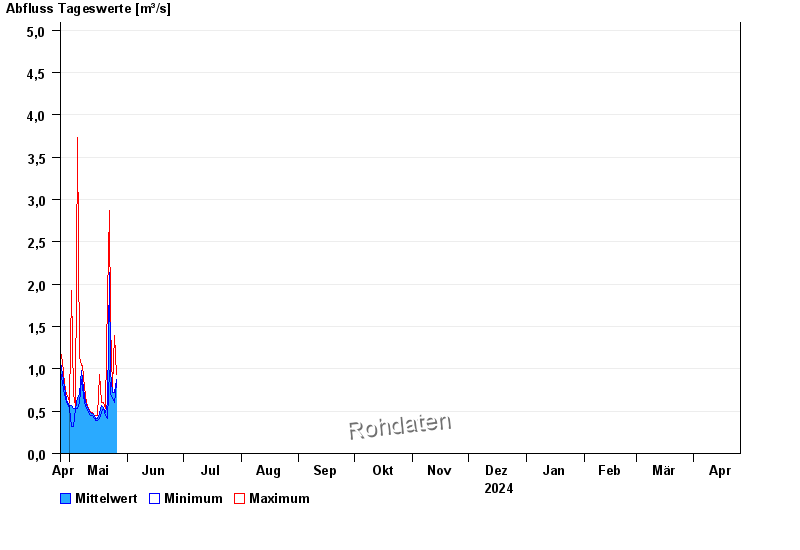
- Chart of year

Chart of year Marktredwitz / Kössein
Discharge from 26.04.2024 to 25.04.2025
- 29.06.2006 Abfluss: 27,9 m³/s
- 01.11.1998 Abfluss: 27,6 m³/s
- 12.02.2005 Abfluss: 27 m³/s
- 26.01.1995 Abfluss: 25,8 m³/s
- 04.12.1988 Abfluss: 24,3 m³/s
| Date | Mean value [m³/s] | Maximum [m³/s] | Minimum [m³/s] |
|---|---|---|---|
| 04.05.2024 | 0.527 | 0.565 | 0.526 |
| 03.05.2024 | 0.528 | 0.691 | 0.321 |
| 02.05.2024 | 0.564 | 1.93 | 0.321 |
| 01.05.2024 | 0.552 | 0.605 | 0.526 |
| 30.04.2024 | 0.583 | 0.647 | 0.565 |
| 29.04.2024 | 0.634 | 0.691 | 0.605 |
| 28.04.2024 | 0.783 | 0.83 | 0.691 |
© Bayerisches Landesamt für Umwelt 2024