

Chart of year Mainleus / Main
Discharge from 03.06.2023 to 02.06.2024
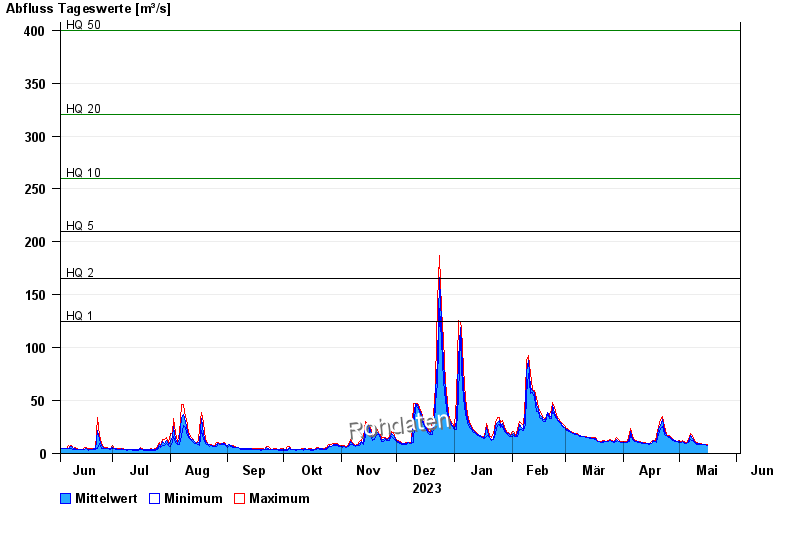
- HQ1 125 m³/s
- HQ2 165 m³/s
- HQ5 210 m³/s
- HQ10 260 m³/s
- HQ20 320 m³/s
- HQ50 400 m³/s
- HQ100 460 m³/s
| Date | Mean value [m³/s] | Maximum [m³/s] | Minimum [m³/s] |
|---|---|---|---|
| 29.04.2024 | 12 | 12.4 | 11.6 |
| 28.04.2024 | 13 | 13.5 | 12.4 |
| 27.04.2024 | 14.1 | 14.7 | 13.5 |
| 26.04.2024 | 15.7 | 16.7 | 14.7 |
| 25.04.2024 | 16.2 | 16.7 | 15.5 |
| 24.04.2024 | 17.2 | 18.4 | 16.7 |
| 23.04.2024 | 21.5 | 25.6 | 18.4 |
© Bayerisches Landesamt für Umwelt 2024