
- Start >
- Rivers >
- Discharge >
- Bayern >
- Lorenzreuth >
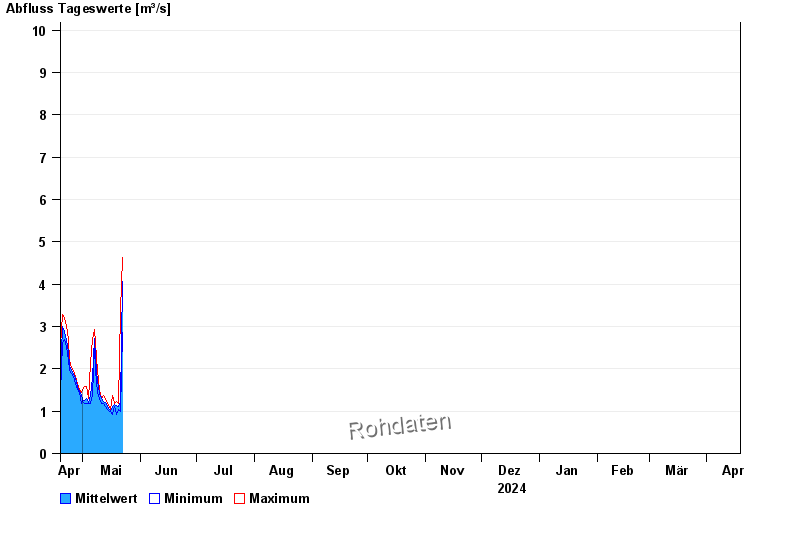
- Chart of year

Chart of year Lorenzreuth / Röslau
Discharge from 19.04.2024 to 18.04.2025
- HQ2 25 m³/s
- HQ5 32 m³/s
- HQ10 38 m³/s
- HQ20 46 m³/s
- HQ50 57 m³/s
- HQ100 64 m³/s
| Date | Mean value [m³/s] | Maximum [m³/s] | Minimum [m³/s] |
|---|---|---|---|
| 01.05.2024 | 1.33 | 1.59 | 1.31 |
| 30.04.2024 | 1.4 | 1.44 | 1.18 |
| 29.04.2024 | 1.47 | 1.52 | 1.44 |
| 28.04.2024 | 1.59 | 1.66 | 1.52 |
| 27.04.2024 | 1.77 | 1.81 | 1.66 |
| 26.04.2024 | 1.89 | 1.96 | 1.81 |
| 25.04.2024 | 1.96 | 2.04 | 1.89 |
© Bayerisches Landesamt für Umwelt 2024