

Chart of year Lohma Q / Zottbach
Discharge from 29.05.2023 to 28.05.2024
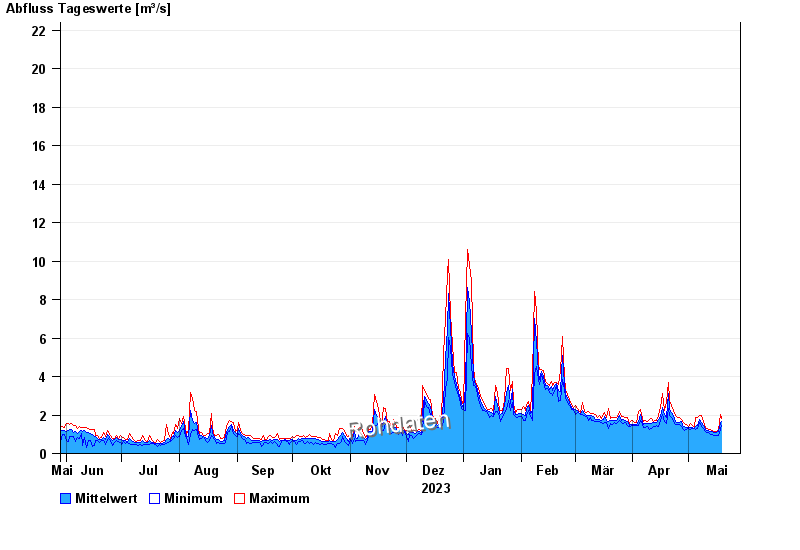 Für diesen Pegel sind keine Jährlichkeiten hinterlegt.
note
Abflusswerte sind Werte der Ultraschallanlage!
| Date | Mean value [m³/s] | Maximum [m³/s] | Minimum [m³/s] |
|---|---|---|---|
| 07.05.2024 | 1.79 | 1.96 | 1.65 |
| 06.05.2024 | 1.47 | 1.85 | 1.31 |
| 05.05.2024 | 1.4 | 1.89 | 1.27 |
| 04.05.2024 | 1.32 | 1.41 | 1.29 |
| 03.05.2024 | 1.35 | 1.48 | 1.29 |
| 02.05.2024 | 1.34 | 1.55 | 1.26 |
| 01.05.2024 | 1.34 | 1.41 | 1.3 |
© Bayerisches Landesamt für Umwelt 2024